
Introduction
Reference intervals are essential in clinical laboratories because they help clinicians determine whether a patient’s laboratory value is normal or abnormal. However, many biological measurements vary with age. For example, hemoglobin, cholesterol, creatinine, hormone levels, and many biochemical markers often change throughout childhood, adulthood, and old age.
Using a single reference interval for all age groups may lead to incorrect clinical interpretations. Age-related reference interval analysis solves this problem by estimating reference ranges that change continuously with age.
MedCalc provides a specialized Age-related Reference Interval procedure that models the relationship between age and a laboratory measurement and calculates age-specific reference limits.
In this tutorial, we demonstrate Age-related Reference Interval analysis in MedCalc using a biomedical dataset containing Hemoglobin (g/dL) measurements collected from individuals of different ages.
What is an Age-related Reference Interval?
An Age-related Reference Interval is a range of expected values that varies according to age.
Instead of calculating one lower and upper reference limit for the entire population, the interval changes as age changes.
General Formula
Reference Interval:
Lower Limit = Mean − Z × SD
Upper Limit = Mean + Z × SD
Where:
- Mean changes with age
- Standard deviation changes with age
- Z-score corresponds to the selected percentile
This approach provides more realistic and clinically meaningful reference ranges.
Why Use Age-related Reference Intervals?
Age-related intervals are useful when:
- Hemoglobin changes with age
- Growth-related biomarkers vary during childhood
- Hormone concentrations vary across age groups
- Kidney function markers change in older adults
- Pediatric laboratory tests require age-specific interpretation
Benefits:
- More accurate diagnosis
- Reduced false positives
- Better clinical decision making
- Personalized interpretation
Example Biomedical Dataset
The following dataset was used for this demonstration.
| Age (Years) | Hemoglobin (g/dL) |
|---|---|
| 5 | 11.2 |
| 8 | 11.8 |
| 15 | 12.5 |
| 18 | 13.4 |
| 24 | 14.1 |
| 35 | 14.8 |
| 45 | 14.6 |
| 55 | 14.0 |
| 65 | 13.4 |
| 75 | 12.8 |
| 85 | 12.1 |
This dataset illustrates how hemoglobin varies across different ages.
Step-by-Step Procedure in MedCalc
Step 1: Enter Data
Create two columns:
| Column | Variable |
|---|---|
| A | Age |
| B | Hemoglobin |
Step 2: Open Age-related Reference Interval
Navigate to:
Statistics → Reference Intervals → Age-related Reference Interval
The analysis window appears.
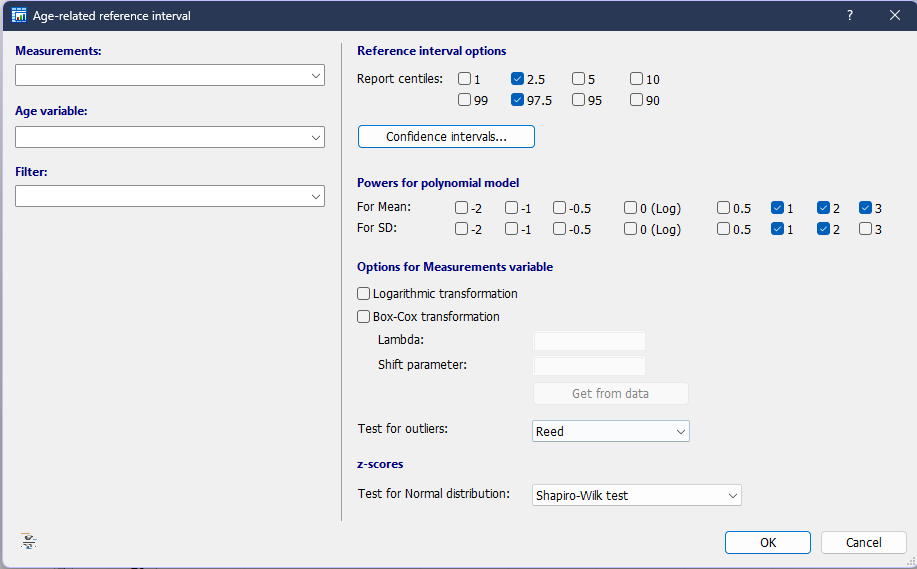
Step 3: Select Variables
Measurements
Select:
Hemoglobin (g/dL)
Age Variable
Select:
Age (Years)
Understanding All Options in MedCalc
1. Report Centiles
Options available:
- 1 and 99
- 2.5 and 97.5
- 5 and 95
- 10 and 90
Selected
✔ 2.5 and 97.5
Why?
These produce the standard 95% reference interval, commonly used in clinical laboratories.
2. Confidence Intervals
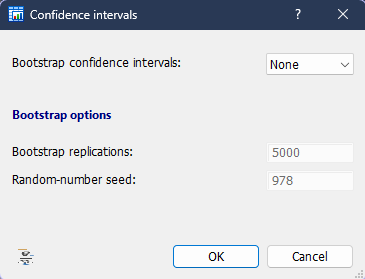
This button opens additional settings.
Bootstrap Confidence Intervals
Options:
- None
- Bootstrap
Bootstrap Replications
Default:
5000
Random Seed
Default:
978
Purpose
Bootstrap repeatedly resamples the data and estimates confidence intervals around the reference limits.
Why Use It?
Provides more reliable confidence intervals when sample sizes are limited.
3. Powers for Polynomial Model
For Mean
Options:
- Age⁻²
- Age⁻¹
- Age⁻⁰·⁵
- Log(Age)
- Age⁰·⁵
- Age¹
- Age²
- Age³
Selected
✔ Age¹
✔ Age²
✔ Age³
Interpretation
MedCalc models the mean hemoglobin value as:
Mean = β₀ + β₁Age + β₂Age² + β₃Age³
This cubic polynomial captures nonlinear age trends.
For Standard Deviation
Selected:
✔ Age¹
✔ Age²
This models variability as age changes.
4. Logarithmic Transformation
Transforms data using logarithms.
Useful when:
- Data are right-skewed
- Variance increases with magnitude
Selected:
✘ Not selected
Reason:
Hemoglobin values were approximately normal.
5. Box-Cox Transformation
Automatically transforms non-normal data.
Useful when:
- Data violate normality assumptions
Selected:
✘ Not selected
Reason:
Normality was acceptable.
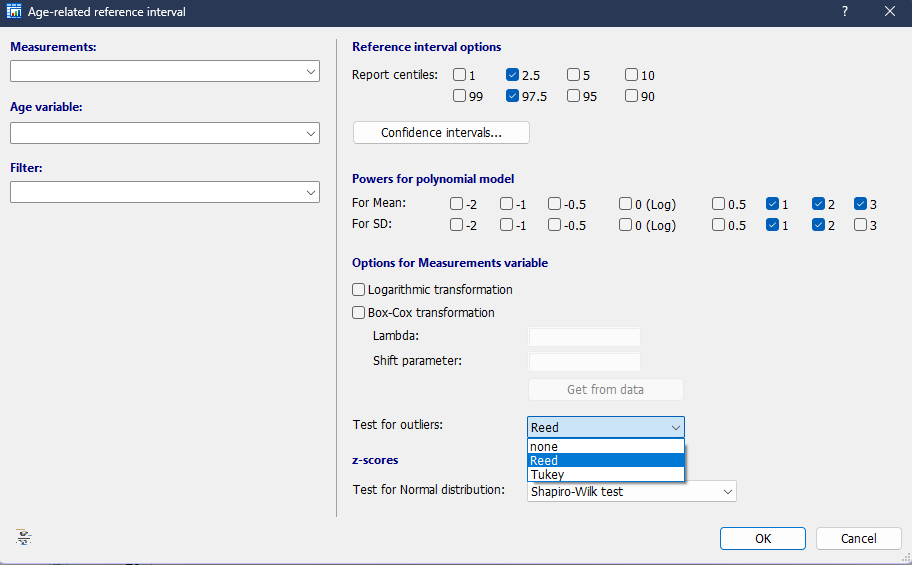
6. Test for Outliers
Options:
- None
- Reed
- Tukey
Selected
✔ Reed
Reed Test
Identifies extreme observations that may distort reference intervals.
Result:
No suspected outliers were detected.
7. Test for Normal Distribution
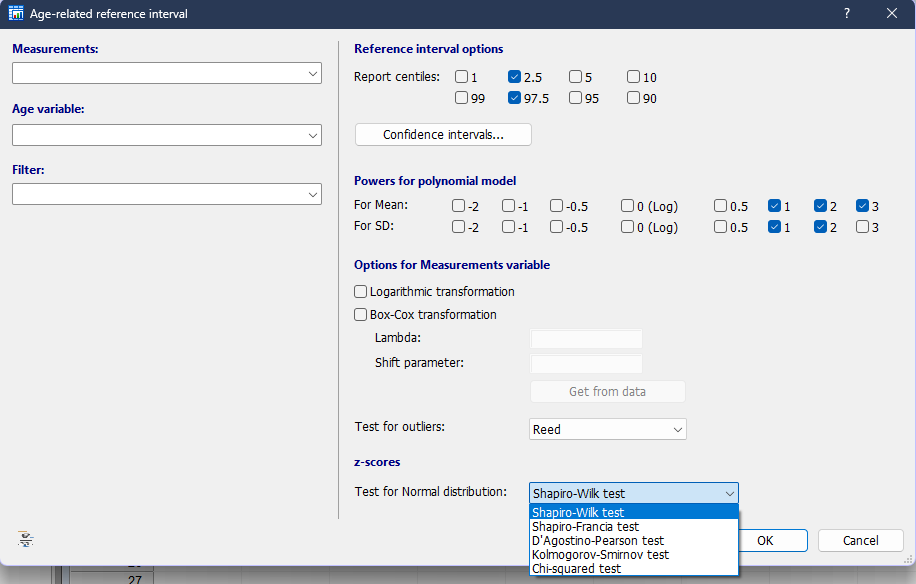
Options:
- Shapiro-Wilk
- Shapiro-Francia
- D’Agostino-Pearson
- Kolmogorov-Smirnov
- Chi-square
Selected
✔ Shapiro-Wilk Test
Reason:
Recommended for small sample sizes.
Results Obtained
The MedCalc output showed:
| Statistic | Result |
|---|---|
| Sample Size | 11 |
| Outliers | None |
| Shapiro-Wilk P-value | 0.1273 |
| Normality | Accepted |
| Skewness P-value | 0.0634 |
| Kurtosis P-value | 0.3261 |
Interpretation:
Since P > 0.05, the data follow an approximately normal distribution.
Model Summary
Mean Model
MedCalc estimated:
Mean = 9.9102 + 0.2764(Age) − 0.004895(Age²) + 0.00002289(Age³)
Interpretation:
Hemoglobin increases during early adulthood, peaks around middle age, and declines slightly in older ages.
Standard Deviation Model
SD = -0.02769 + 0.008018(Age) − 0.00009164(Age²)
Interpretation:
Variation changes with age and is not constant across the population.
Age-specific Reference Intervals
MedCalc calculated the following age-specific limits.
| Age | Lower Limit | Upper Limit |
|---|---|---|
| 10 | 12.12 | 12.29 |
| 20 | 13.48 | 13.85 |
| 30 | 14.16 | 14.67 |
| 40 | 14.31 | 14.89 |
| 50 | 14.07 | 14.64 |
| 60 | 13.58 | 14.06 |
| 70 | 12.96 | 13.29 |
| 80 | 12.36 | 12.47 |
Interpretation:
The highest expected hemoglobin values occur around ages 30–50 years and decline thereafter.
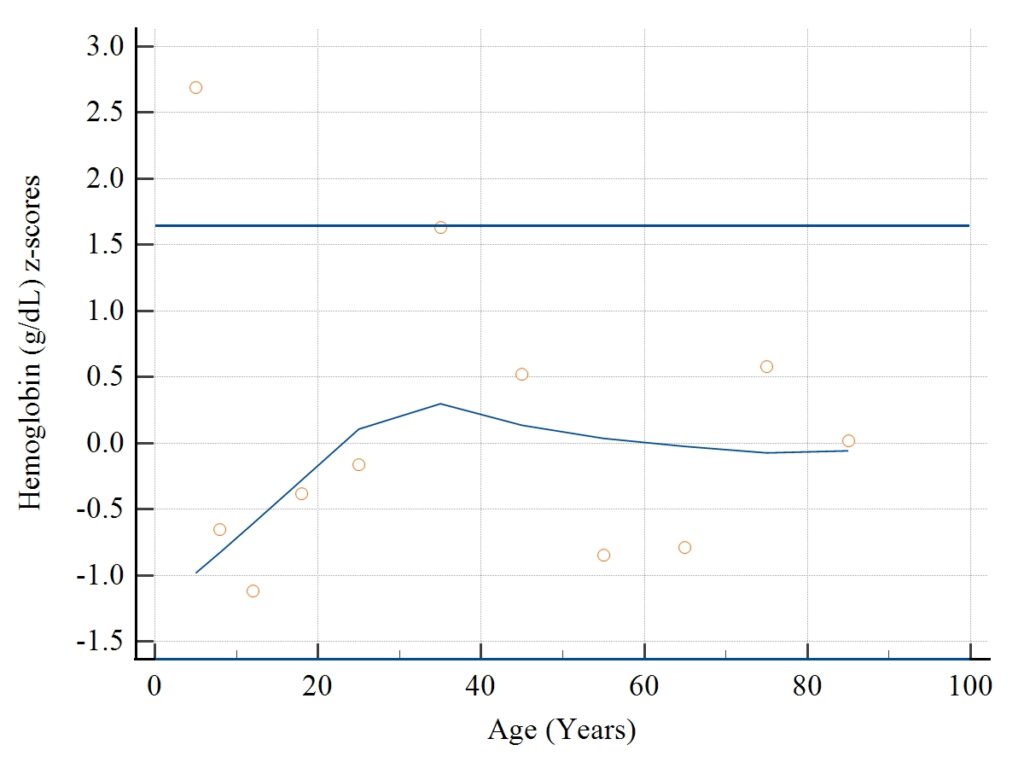
Interpretation of the Z-score Plot
The Z-score plot evaluates model adequacy.
Observations:
- Most points lie within expected limits
- No major departures from normality
- No extreme outliers
- Model fits data reasonably well
Interpretation:
The polynomial model is appropriate for describing age-related changes in hemoglobin.
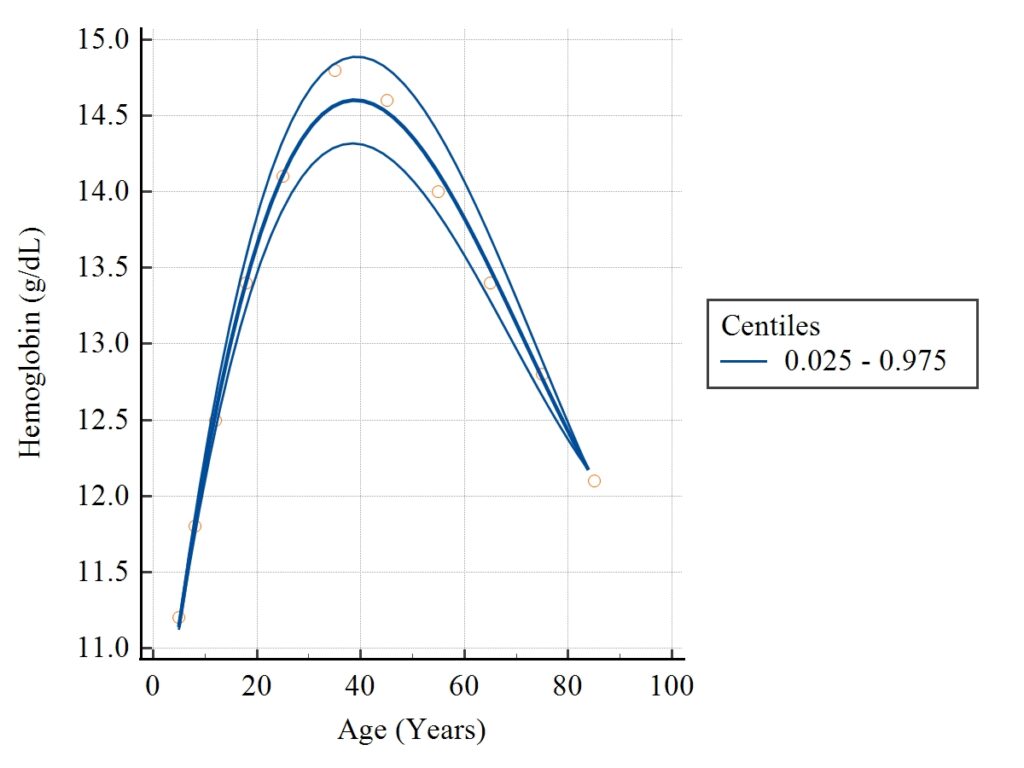
Interpretation of the Centile Plot
The centile plot shows:
- Individual observations
- Predicted mean curve
- Lower reference limit
- Upper reference limit
Key Findings:
Childhood
Lower hemoglobin values are expected.
Young Adults
Hemoglobin increases steadily.
Middle Age
Peak values occur.
Older Adults
Gradual decline observed.
The centile curves provide age-specific clinical reference limits.
Clinical Interpretation
Suppose:
Patient Age = 70 years
Hemoglobin = 12.5 g/dL
Reference interval at age 70:
12.96 – 13.29 g/dL
Interpretation:
12.5 g/dL is below the lower limit and may indicate anemia.
Using a general reference interval might miss this age-specific abnormality.
Advantages of Age-related Reference Intervals
- Age-specific interpretation
- Improved diagnostic accuracy
- Better pediatric reference ranges
- Better geriatric assessment
- Reduced classification errors
- Supports precision medicine
Conclusion
Age-related Reference Interval analysis in MedCalc is a powerful technique for creating clinically meaningful reference ranges that change with age. In this example, hemoglobin values increased during early adulthood, peaked around middle age, and gradually declined in older adults. The Shapiro-Wilk test confirmed normality, the Reed test found no outliers, and polynomial regression successfully modeled the age trend. By using age-specific reference limits instead of a single population-wide interval, clinicians can make more accurate diagnoses and improve patient care.



