
Introduction
In biomedical and laboratory research, obtaining reliable measurements is essential. When the same sample is measured twice, the difference between the two measurements provides useful information about the repeatability and measurement variability of the analytical procedure.
Coefficient of Variation (CV) from Duplicate Measurements is a MedCalc procedure designed to estimate the reproducibility of measurements obtained from duplicate observations across a number of subjects or materials. It provides an alternative to repeatedly measuring one subject or material many times to estimate within-run imprecision.
What is the Coefficient of Variation?
The Coefficient of Variation (CV) is a relative measure of variability. It expresses the standard deviation in relation to the mean and is usually reported as a percentage.
A smaller CV indicates that measurements show less relative variability, whereas a larger CV indicates greater relative variability.
In duplicate-measurement analysis, each sample contributes a pair of observations:
Sample → Measurement 1 + Measurement 2 → Duplicate variability → CV (%)
For example:
| Sample | Measurement 1 | Measurement 2 |
|---|---|---|
| Sample 01 | 82 | 83 |
| Sample 02 | 91 | 90 |
| Sample 03 | 98 | 99 |
| Sample 04 | 105 | 107 |
The two measurements for each sample are close to one another, suggesting relatively low duplicate-measurement variability.
MedCalc specifically provides three approaches for estimating the CV from duplicate measurements: Root mean square, Logarithmic, and Within-subject standard deviation. The Root mean square and Logarithmic methods also provide confidence intervals for the CV.
Why is CV from Duplicate Measurements Important?
Duplicate measurements are common in biomedical research and laboratory investigations.
This type of analysis can be useful for:
- Laboratory assay evaluation
- Clinical chemistry
- Biomarker research
- Analytical precision assessment
- Measurement reproducibility
- Laboratory method evaluation
- Quality assessment studies
- Biomedical research
The important question is not simply whether two measurements are identical. Instead, we want to quantify how much variation exists between duplicate measurements relative to the magnitude of the measurements.
A CV therefore provides a standardized way of describing relative variability.
Biomedical Dataset
For this tutorial, a generated educational dataset containing 20 serum glucose samples was used.
Each sample has two measurements:
- Glucose – Measurement 1 (mg/dL)
- Glucose – Measurement 2 (mg/dL)
Table 1. Duplicate serum glucose measurements
| Sample ID | Glucose Measurement 1 (mg/dL) | Glucose Measurement 2 (mg/dL) |
|---|---|---|
| 1 | 82 | 83 |
| 2 | 91 | 90 |
| 3 | 98 | 99 |
| 4 | 105 | 107 |
| 5 | 112 | 113 |
| 6 | 120 | 121 |
| 7 | 128 | 130 |
| 8 | 135 | 134 |
| 9 | 143 | 145 |
| 10 | 150 | 152 |
| 11 | 158 | 157 |
| 12 | 166 | 168 |
| 13 | 175 | 177 |
| 14 | 184 | 183 |
| 15 | 193 | 195 |
| 16 | 202 | 205 |
| 17 | 215 | 217 |
| 18 | 228 | 230 |
| 19 | 240 | 242 |
| 20 | 255 | 252 |
Important: This is a generated educational dataset, not a collection of real patient measurements and should not be used to establish clinical or laboratory acceptance limits.
How to Perform CV from Duplicate Measurements in MedCalc
Open MedCalc and navigate to:
Statistics → Method comparison & evaluation → Coefficient of variation from duplicate measurements
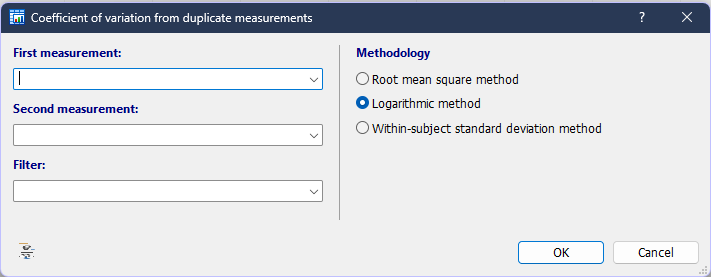
Option 1: First Measurement
The First measurement field is used to select the first variable containing measurements for each sample.
For this example:
First measurement = Glucose – Measurement 1 (mg/dL)
Each row represents one sample, and the selected variable contains the first observation for that sample.
Option 2: Second Measurement
The Second measurement field contains the second measurement obtained from the same sample.
For this example:
Second measurement = Glucose – Measurement 2 (mg/dL)
The two measurements are therefore paired within each sample.
MedCalc notes that the order of the two measurement variables is not important.
Option 3: Filter
The Filter field can be used when only selected observations should be included.
For example, a larger biomedical dataset could contain:
- Control samples
- Patient samples
- Different treatment groups
- Different laboratories
- Different concentration categories
A filter could then restrict the analysis to a particular subset.
Filter = None
Therefore, all 20 duplicate pairs are included.
Methodology Options
The most important part of the MedCalc dialog is the Methodology section.
MedCalc provides three approaches.
1. Root Mean Square Method
The Root mean square method calculates CV from the relative difference between each pair of measurements.
MedCalc defines the calculation as:
CV (%) = 100 × √[Σ(d/m)² / 2n]
where:
- d = difference between the two paired measurements
- m = mean of the paired measurements
- n = number of measurement pairs
This approach cannot be used if the mean of one or more measurement pairs is zero.
Practical interpretation
The method considers the size of the duplicate difference relative to the magnitude of the measurement.
2. Logarithmic Method
The Logarithmic method is the methodology selected in the uploaded MedCalc analysis.
For this method, MedCalc first calculates the squared differences between the natural logarithms of the paired observations:
sl = Σ[ln(x₁) − ln(x₂)]²
The CV is then obtained using the exponential transformation.
Why is this useful?
A logarithmic approach is particularly useful when measurement variability behaves proportionally to the magnitude of the measurement.
Important restriction
The Logarithmic method cannot be used if any observation is zero or negative.
Therefore, this method should not simply be selected without checking the data first.
3. Within-Subject Standard Deviation Method
The third option is the Within-subject standard deviation method.
MedCalc calculates the within-subject SD using the differences between paired observations and then calculates:
CV (%) = 100 × SD / Mean
This method assumes that the standard deviation can reasonably be considered constant across the concentration interval.
An important distinction is that no confidence interval is reported for the CV with this method.
Results Obtained from MedCalc
- Sample size = 20
- Overall mean = 159.5000 mg/dL
- Coefficient of variation = 0.8059%
- 95% confidence interval = 0.5385% to 1.0740%
- Method = Logarithmic method
Table 2. MedCalc result
| Result | Value |
|---|---|
| Sample size | 20 |
| Overall mean | 159.5000 mg/dL |
| Coefficient of variation | 0.8059% |
| 95% CI for CV | 0.5385% to 1.0740% |
| Methodology | Logarithmic method |
The result demonstrates that the duplicate measurements in this educational dataset have relatively small variation in relation to their overall measurement magnitude.
Interpretation of the Overall Mean
The overall mean reported by MedCalc is:
159.5000 mg/dL
This represents the overall mean calculated from the duplicate measurements.
It provides the reference magnitude against which the relative variability represented by the CV can be understood.
The mean itself is not a measure of precision. The CV provides the relative variability information.
Interpretation of the Coefficient of Variation
The calculated CV is:
CV = 0.8059%
This means that the estimated relative variability of the duplicate measurements is approximately 0.81% in this generated dataset.
Because the duplicate measurements are generally close to each other, the resulting CV is relatively small.
A smaller CV generally indicates less relative variability, while a larger CV indicates greater relative variability.
However, 0.8059% should not be interpreted as a universal acceptable CV for serum glucose measurement. An acceptable analytical CV depends on the assay, laboratory requirements, analytical performance specifications, and clinical purpose.
Interpretation of the 95% Confidence Interval
The MedCalc result gives:
95% CI = 0.5385% to 1.0740%
This interval represents the uncertainty around the estimated CV.
The point estimate is 0.8059%, while the confidence interval extends from 0.5385% to 1.0740%.
The confidence interval is important because the CV calculated from 20 sample pairs is an estimate rather than an exact population parameter.
MedCalc’s Root mean square and Logarithmic approaches provide confidence intervals for the CV.
Result Table Explanation
The MedCalc output can be presented in a research article as follows.
Table 3. Coefficient of variation from duplicate measurements
| Parameter | Result |
|---|---|
| Number of duplicate pairs | 20 |
| Overall mean | 159.5000 mg/dL |
| CV | 0.8059% |
| 95% CI | 0.5385–1.0740% |
| Calculation method | Logarithmic |
Suggested interpretation for the table
The analysis of 20 duplicate serum glucose measurements using the logarithmic method produced a coefficient of variation of 0.8059% (95% CI: 0.5385–1.0740%). The relatively small CV indicates low relative variability between duplicate measurements in this educational dataset.
Why the Logarithmic Method Was Used
The logarithmic method was selected for this example because it provides a useful approach when duplicate-measurement variability is considered relative to measurement magnitude.
It also provides a confidence interval for the estimated CV. MedCalc identifies the Root mean square and Logarithmic approaches as the recommended methods, while the within-subject SD method requires an assumption of reasonably constant SD across the concentration range.
CV Is Not the Same as Agreement
An important statistical point is that CV should not be confused with agreement between two analytical methods.
CV from duplicate measurements evaluates variability between repeated measurements.
If the objective is to determine whether two different analytical methods agree, procedures such as Bland–Altman analysis, Deming regression, or Passing-Bablok regression may be more appropriate depending on the research question.
MedCalc separately provides these procedures within its Method comparison & evaluation section.
Applications in Biomedical Research
Coefficient of Variation from duplicate measurements can be useful when researchers want to quantify measurement reproducibility without repeatedly measuring the same material many times.
Potential applications include:
Clinical chemistry
Duplicate glucose, cholesterol, enzyme, or other biochemical measurements.
Biomarker research
Evaluation of variability in laboratory biomarkers.
Assay evaluation
Assessment of analytical precision during method development.
Laboratory research
Quantification of measurement variation across multiple samples.
Method evaluation
Providing information about measurement imprecision that can complement other method-comparison procedures.
Conclusion
Coefficient of Variation from Duplicate Measurements is a useful MedCalc procedure for estimating relative measurement variability from paired observations. It is particularly useful when researchers have duplicate measurements from a series of samples and want to quantify reproducibility without repeatedly measuring one sample many times.
In this example, 20 duplicate serum glucose measurements were analyzed using the Logarithmic method. The resulting CV was 0.8059%, with a 95% confidence interval of 0.5385% to 1.0740%. The relatively small CV indicates low relative variability among the duplicate measurements in this generated educational dataset.
The result should not be interpreted as a universal quality specification for glucose testing. Instead, it demonstrates how MedCalc calculates and reports a CV and its confidence interval.
For a complete evaluation of laboratory measurement performance, CV can be considered alongside other appropriate analytical and method-comparison procedures.



