Introduction
In biomedical research, measuring a patient’s condition before and after treatment is an important way to evaluate clinical improvement. Researchers often collect measurements at baseline and follow-up to determine whether a treatment, rehabilitation programme, or clinical intervention produces a meaningful change.
However, observing a difference between two measurements is not the only consideration. Researchers also need to understand the magnitude of the change relative to the variability of the measurements. Responsiveness is an important measurement property that describes the ability of an instrument or outcome measure to detect change over time.
MedCalc provides a responsiveness analysis that calculates several indices, including effect size using the baseline standard deviation, effect size using the pooled standard deviation, and the standardized response mean. These indices help researchers quantify changes in continuous biomedical measurements.
What Is Responsiveness?
Responsiveness is the ability of a measurement instrument or outcome measure to detect change in a patient’s health status over time when a real change has occurred.
For example, a six-minute walk test measures the distance a person can walk in six minutes. In a pulmonary rehabilitation study, this distance may be recorded before and after a rehabilitation programme. An increase in walking distance may indicate improved functional exercise capacity.
Responsiveness is particularly relevant to:
- Clinical trials evaluating treatment effectiveness.
- Rehabilitation studies measuring functional recovery.
- Patient-reported outcome measures.
- Research assessing quality of life before and after treatment.
- Biomedical studies evaluating changes in physiological measurements.
Responsiveness should not be confused with reliability. Reliability concerns the consistency of measurements, whereas responsiveness concerns the ability to detect change. A measure may be reliable but still be insufficiently sensitive to clinically important changes.
Responsiveness indices quantify the observed change relative to a measure of variability. Their interpretation should consider the study design, the characteristics of the outcome measure, and the clinical context.
Biomedical Example: Pulmonary Rehabilitation
Consider a simulated biomedical dataset involving 20 patients participating in a pulmonary rehabilitation programme. Each patient’s six-minute walk distance was measured before and after rehabilitation, with the distance recorded in metres.
The two measurements are paired because both observations belong to the same patient.
The dataset contains the following variables:
| Variable | Description |
|---|---|
| Patient_ID | Unique patient identification number |
| Before_Rehabilitation_m | Six-minute walk distance before rehabilitation, in metres |
| After_Rehabilitation_m | Six-minute walk distance after rehabilitation, in metres |
The purpose of the example is to evaluate the magnitude of the change in walking distance and quantify responsiveness using standard indices. The dataset is simulated for educational purposes and does not represent actual patient records.
Dataset download placement: Insert the Excel dataset download link immediately after this section and before the “Results and Interpretation” heading.
Download Episode 67 Responsiveness dataset
Results and Interpretation
The MedCalc report contains descriptive statistics for the two measurements, the difference between the measurements, the pooled standard deviation, the standard deviation of paired differences, and three indices of responsiveness. The confidence intervals were calculated using the bias-corrected and accelerated (BCa) bootstrap method with 1,000 iterations and random seed 978.
Table 1. Descriptive statistics for measurements before and after rehabilitation
| Statistic | Before rehabilitation | After rehabilitation |
|---|---|---|
| Sample size | 20 | 20 |
| Mean distance (m) | 319.25 | 366.50 |
| Variance | 795.4605 | 1579.2105 |
| Standard deviation (m) | 28.2039 | 39.7393 |
Explanation of Table 1: The mean walking distance increased from 319.25 metres before rehabilitation to 366.50 metres afterward. This represents a higher average walking distance at follow-up.
The standard deviation increased from 28.2039 to 39.7393 metres, indicating greater dispersion in the follow-up measurements. This difference in variability is relevant because the responsiveness indices use standard deviations as denominators.
The descriptive statistics demonstrate a change in the group mean, but they do not, by themselves, establish the clinical importance of the observed improvement.
Table 2. Difference and variability statistics
| Statistic | Result |
|---|---|
| Mean difference (second measurement − first measurement) | 47.2500 m |
| Pooled standard deviation | 34.4577 m |
| Standard deviation of paired differences | 12.5105 m |
Explanation of Table 2: The mean difference was 47.25 metres, calculated as the mean after rehabilitation minus the mean before rehabilitation. A positive difference indicates that the follow-up mean was higher than the baseline mean.
The pooled standard deviation combines variability information from the two measurement occasions. It is used in the pooled-standard-deviation effect size.
The standard deviation of paired differences describes the variability in the individual changes between the two occasions. It is used to calculate the standardized response mean. These measures of variability are not interchangeable, so the resulting indices may differ.
Responsiveness Indices: Formulas and Interpretation
MedCalc reports three responsiveness indices in this example. Each expresses the observed change relative to a different measure of variability.
1. Effect size using baseline standard deviation
This index, often associated with Glass’s delta, expresses the mean change relative to the baseline standard deviation.
Formula:
Effect size = Mean difference / Baseline standard deviation
For this dataset:
Effect size = 47.25 / 28.2039 = 1.6753
The reported effect size was 1.6753, with a 95% confidence interval from 1.3059 to 2.0634.
This indicates that the average improvement was approximately 1.68 times the baseline standard deviation. Because the baseline standard deviation is used, this index provides a standardized measure of change relative to variability before rehabilitation.
2. Effect size using pooled standard deviation
The pooled-standard-deviation effect size expresses the mean change relative to the pooled variability of the two measurement occasions.
Formula:
Effect size = Mean difference / Pooled standard deviation
For this dataset:
Effect size = 47.25 / 34.4577 = 1.3712
The reported effect size was 1.3712, with a 95% confidence interval from 1.0452 to 1.6923.
This value indicates that the average change was approximately 1.37 pooled standard deviations. It is lower than the baseline-standard-deviation effect size because the pooled standard deviation is larger than the baseline standard deviation in this example.
3. Standardized response mean (SRM)
The standardized response mean expresses the average change relative to the standard deviation of individual paired changes.
Formula:
SRM = Mean paired difference / Standard deviation of paired differences
For this dataset:
SRM = 47.25 / 12.5105 = 3.7768
The reported SRM was 3.7768, with a 95% confidence interval from 2.8545 to 4.8107.
The SRM is large in this dataset because the mean improvement is substantial relative to the variability in individual changes. This suggests that the direction and magnitude of change were relatively consistent across the patients in the simulated example.
The three indices differ because they use different denominators. Their values should be interpreted according to their definitions rather than treated as interchangeable measures.
Table 3. MedCalc responsiveness results and 95% confidence intervals
| Responsiveness index | Estimate | 95% confidence interval |
|---|---|---|
| Effect size using baseline SD | 1.6753 | 1.3059–2.0634 |
| Effect size using pooled SD | 1.3712 | 1.0452–1.6923 |
| Standardized response mean | 3.7768 | 2.8545–4.8107 |
Explanation of Table 3: All three estimates are positive, consistent with the increase in mean walking distance after rehabilitation. Each confidence interval lies entirely above zero, indicating that the estimated standardized change is positive across the reported intervals.
The confidence intervals describe uncertainty around the estimated responsiveness indices. The SRM has the largest numerical estimate, but its scale differs from the other two indices because it uses the standard deviation of paired differences. Therefore, the indices should not be ranked as if they were identical measurements.
The results support evidence of change in this simulated dataset. Whether the improvement is clinically meaningful requires additional context, including an appropriate threshold for meaningful change and evidence about the measurement instrument.
Interpretation of the Supplied Scatter Plot
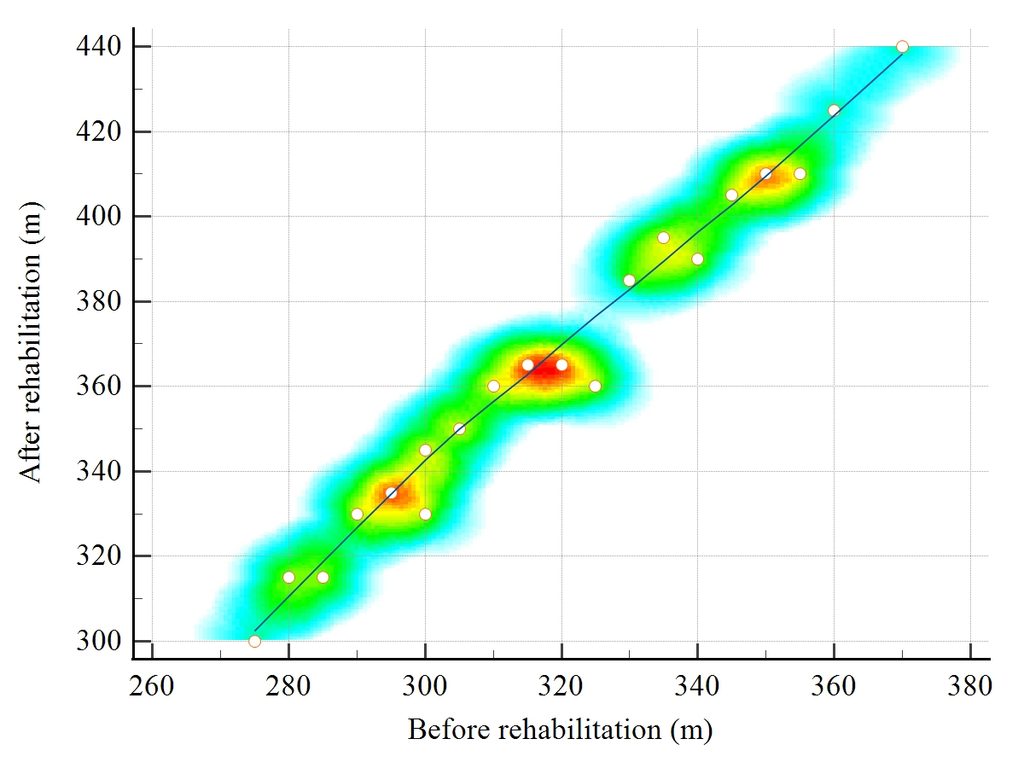
The scatter plot displays the relationship between walking distance before rehabilitation on the horizontal axis and walking distance after rehabilitation on the vertical axis. Each circle represents one patient. The coloured density regions highlight areas where observations are more concentrated, while the blue line shows the overall upward trend in the displayed data.
Several features are important:
1. Positive relationship between measurements: Patients with higher baseline walking distances generally also have higher follow-up distances. This is reflected in the upward pattern of the observations.
2. Higher follow-up values: The plotted follow-up measurements are generally greater than the corresponding baseline measurements, consistent with the positive mean difference of 47.25 metres in the report.
3. Concentration of observations: The denser coloured regions show where several patient observations are clustered. These regions help reveal the distribution of the data but do not independently quantify responsiveness.
4. Variation between patients: The points do not fall perfectly on the fitted trend line. Individual patients differ in their baseline and follow-up distances, even though the overall pattern is positive.
5. Plot limitations: The upward trend line describes the association between baseline and follow-up measurements. It is not, by itself, a measure of responsiveness or a line of equality. A scatter plot alone cannot establish the clinical importance of the change. The numerical indices and their confidence intervals provide complementary information.
Together, the plot and the MedCalc results show an overall increase in walking distance, while also illustrating the variation in measurements across patients.
Understanding the Bootstrap Confidence Intervals
MedCalc reports 95% BCa bootstrap confidence intervals for the three responsiveness indices. The BCa method is a bootstrap approach that adjusts for bias and skewness in the estimated sampling distribution.
In this report, the intervals were based on 1,000 bootstrap iterations with random seed 978. Reporting the method and settings helps readers understand how the intervals were obtained and supports reproducibility.
A confidence interval provides a range of plausible values for the population-level index under the assumptions of the method and study design. It should not be interpreted as the range containing 95% of individual patients’ changes.
Applications and Limitations
Responsiveness analysis can be useful in clinical rehabilitation, treatment evaluation, clinical trials, and validation studies of outcome measures. It helps researchers describe standardized change rather than reporting only raw differences.
Nevertheless, responsiveness indices do not automatically demonstrate treatment effectiveness or causality. In a before-and-after study without a suitable comparison group, changes may also reflect natural recovery, learning effects, concurrent interventions, or other factors.
The indices also depend on the variability of the measurements. Different denominators can produce different values, as seen in this example. Researchers should therefore report which index was used, provide confidence intervals where available, and interpret the results in the context of the outcome measure and clinical setting.
The dataset used here is simulated, so the numerical findings are intended for educational demonstration rather than clinical decision-making.
Conclusion
Responsiveness is an important measurement property in biomedical research because it describes the ability of an outcome measure to detect change over time. In the simulated pulmonary rehabilitation example, the mean six-minute walk distance increased by 47.25 metres, from 319.25 metres at baseline to 366.50 metres after rehabilitation.
MedCalc reported a baseline-standard-deviation effect size of 1.6753, a pooled-standard-deviation effect size of 1.3712, and a standardized response mean of 3.7768. All three reported 95% BCa bootstrap confidence intervals were above zero. The supplied scatter plot also illustrates the positive relationship between baseline and follow-up walking distances and the general increase in follow-up measurements.
These results demonstrate how descriptive statistics, responsiveness indices, confidence intervals, and graphical interpretation can be used together to understand change in biomedical measurements. Researchers should select and interpret the appropriate index according to the study design, measurement properties, and clinical context.