
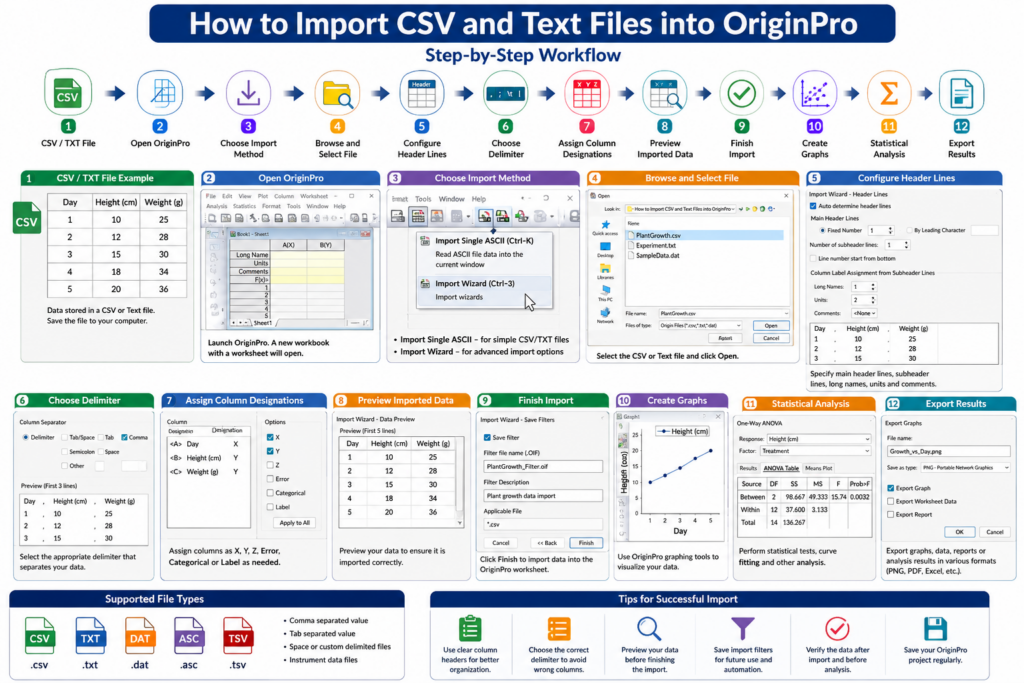
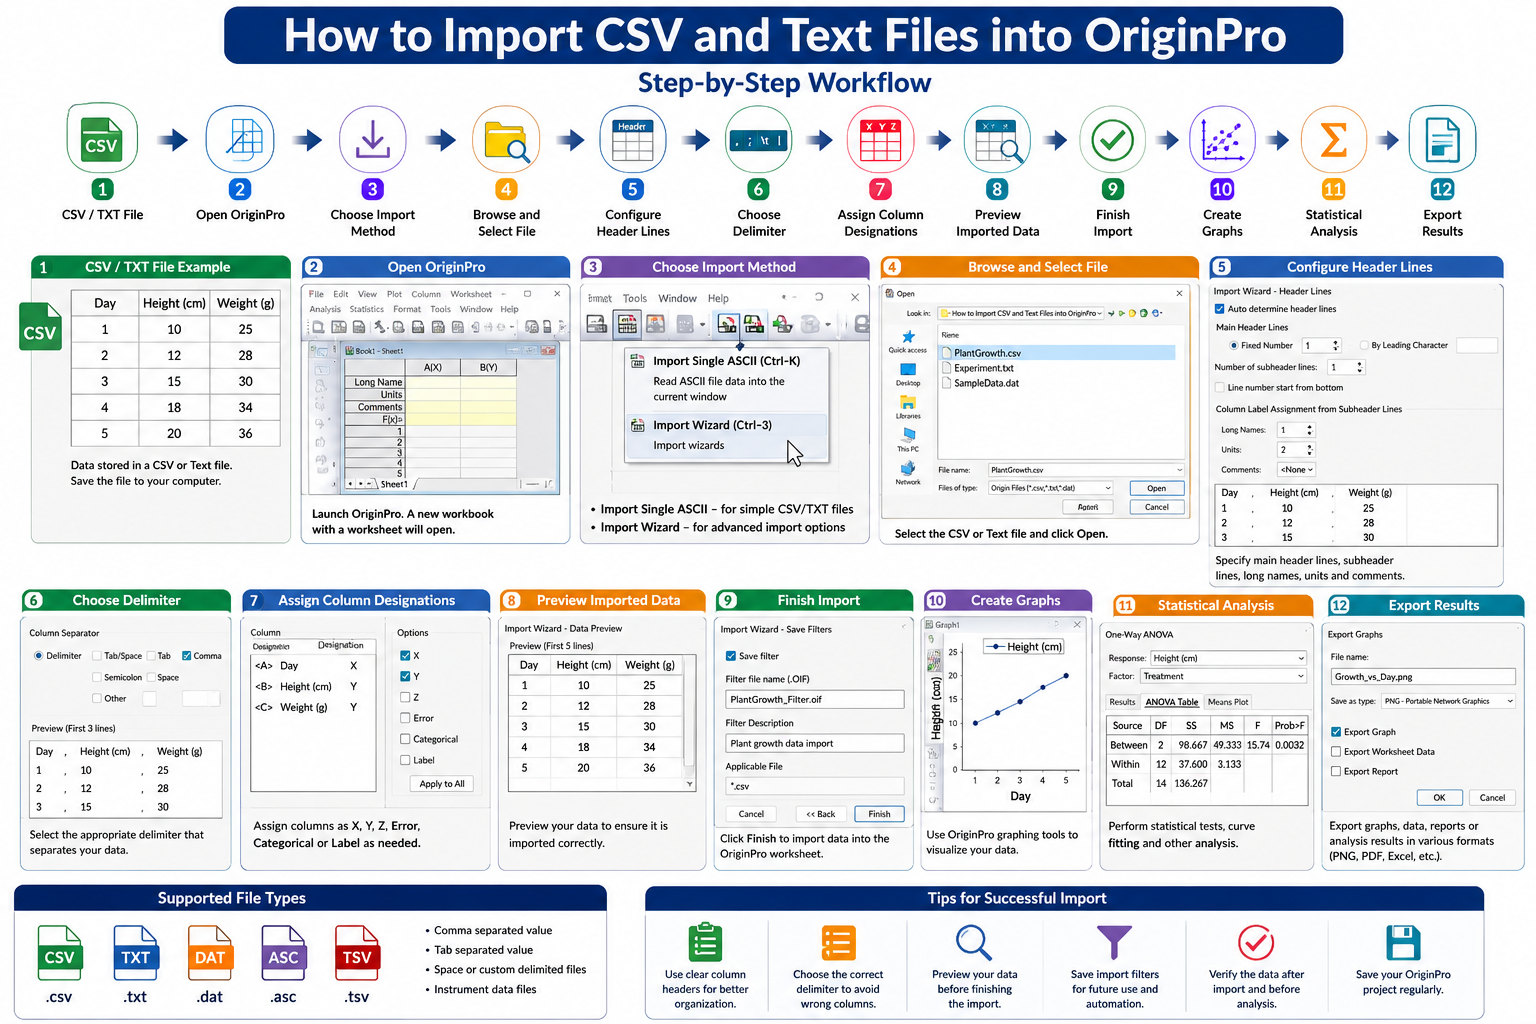
Introduction CSV (Comma-Separated Values) and text files are among


Time Series Regression in R Studio: An Environmental Health Case Study
Introduction Time series regression is a powerful statistical technique widely

Boxplot with Individual Data Points Overlaid in R Studio (with Full R Script & Step-By-Step Guide)
Introduction Data visualization is one of the most essential steps
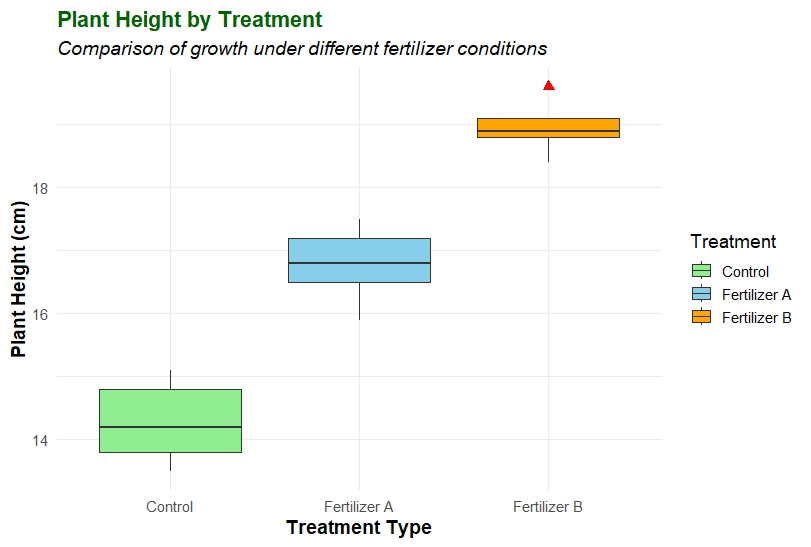
Box Plot in R Using ggplot2 | Step-by-Step Guide with Full Script and Interpretation
Introduction In biostatistics and data analysis, visualizing the distribution of
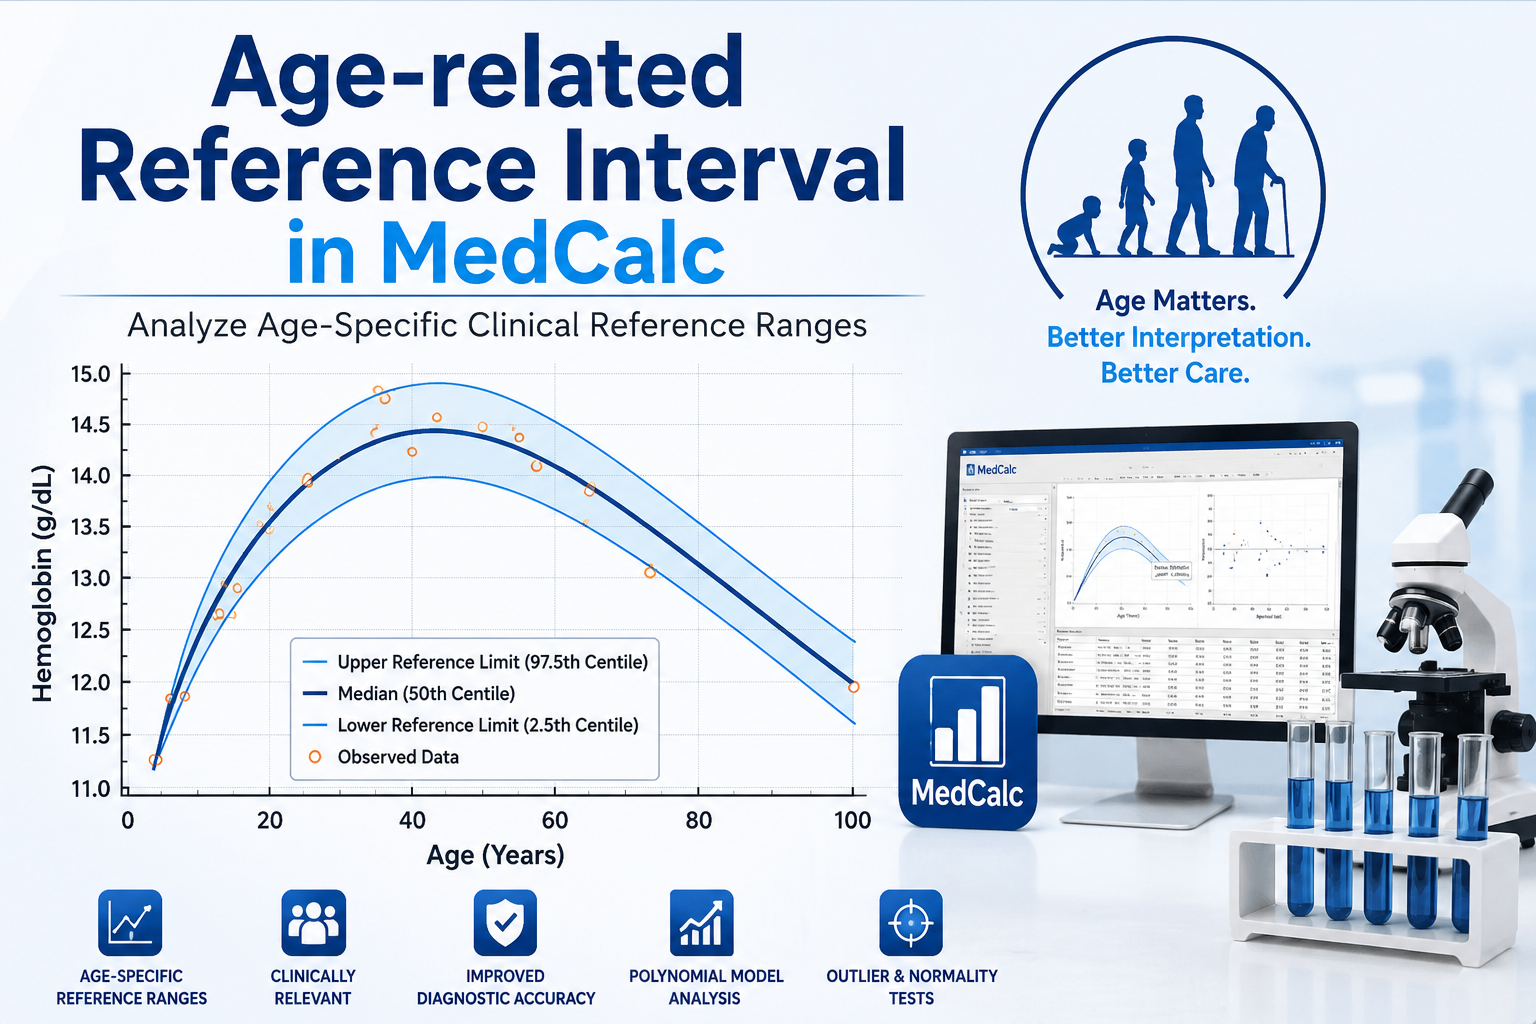


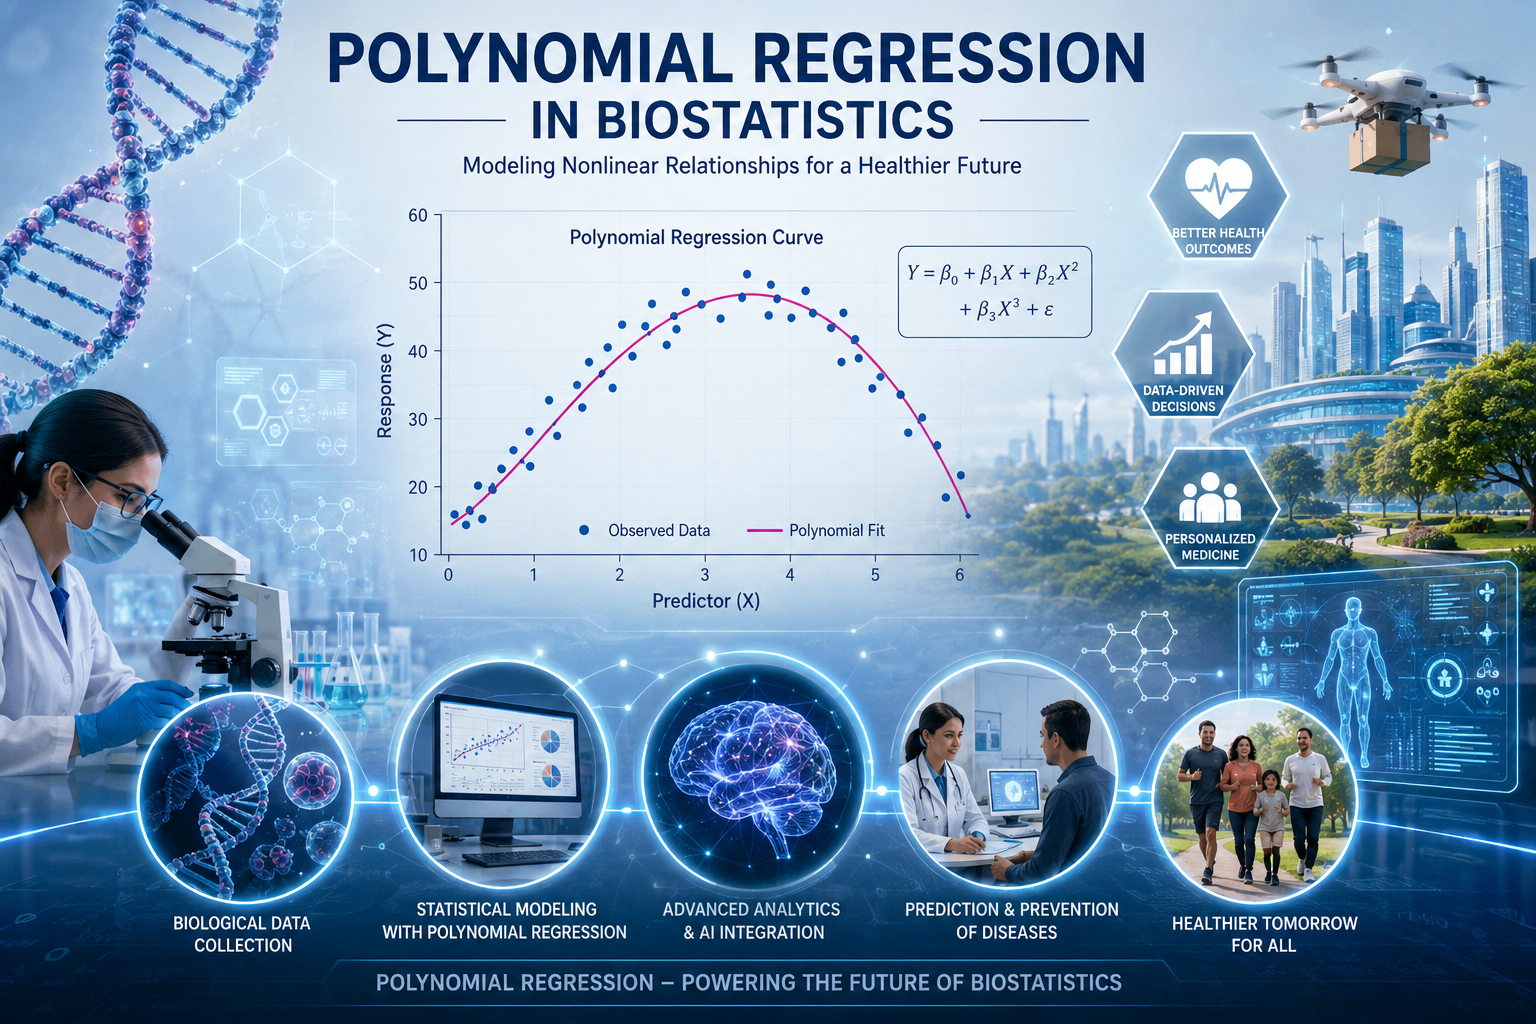
Polynomial Regression in Biostatistics
Introduction Polynomial Regression is an advanced statistical technique used in
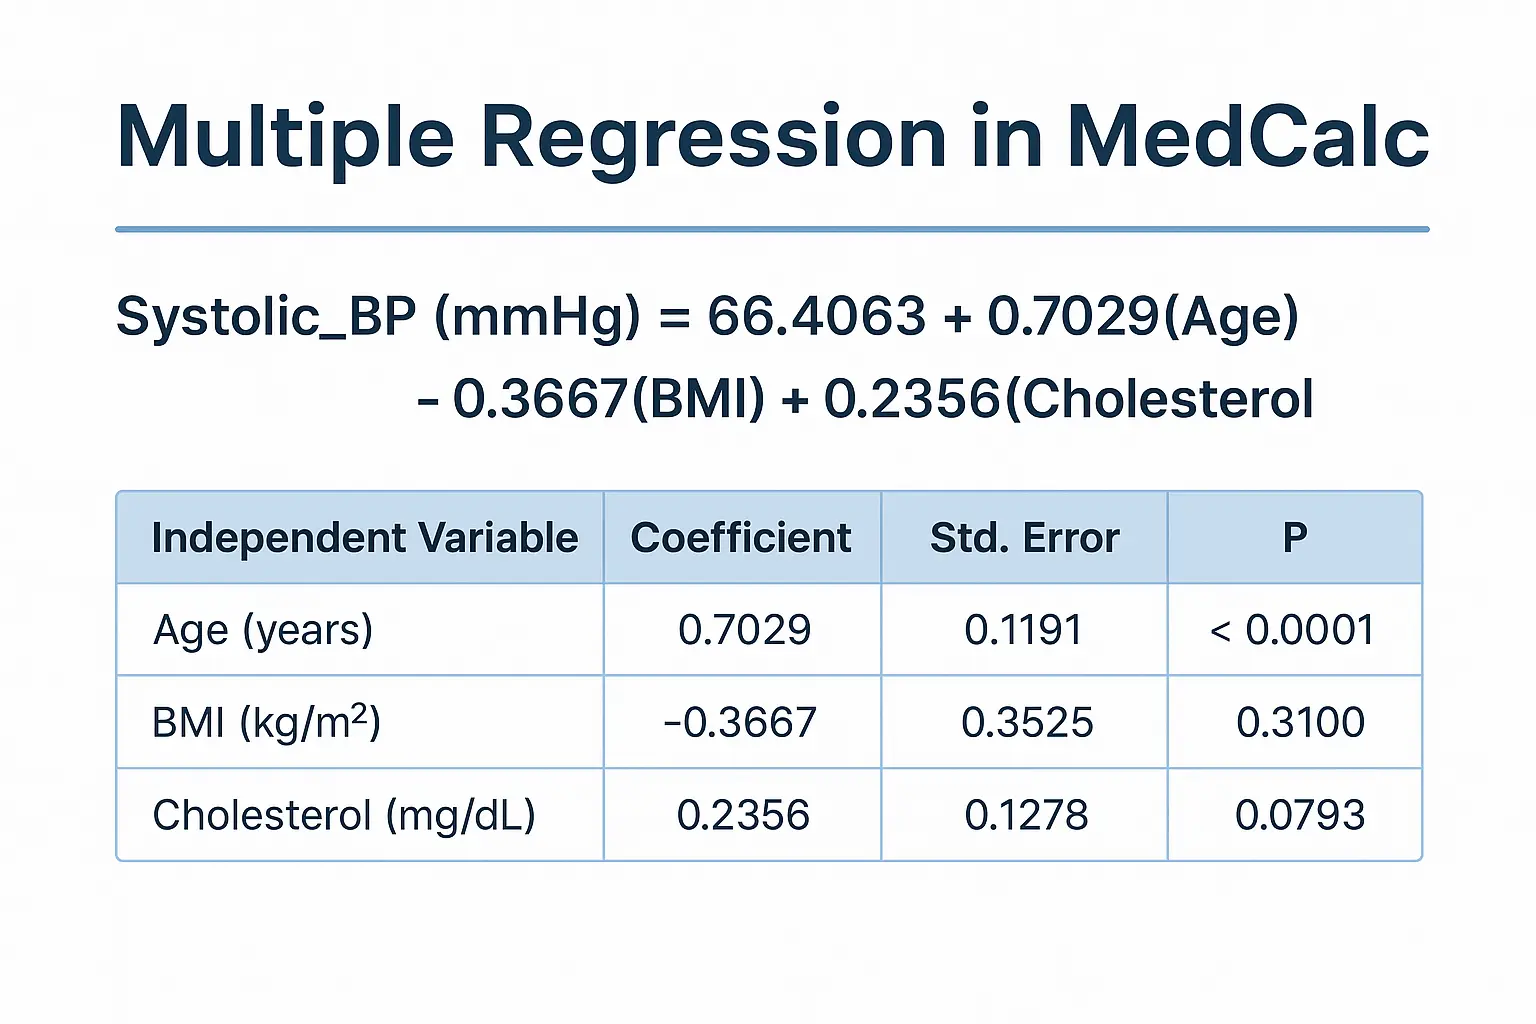
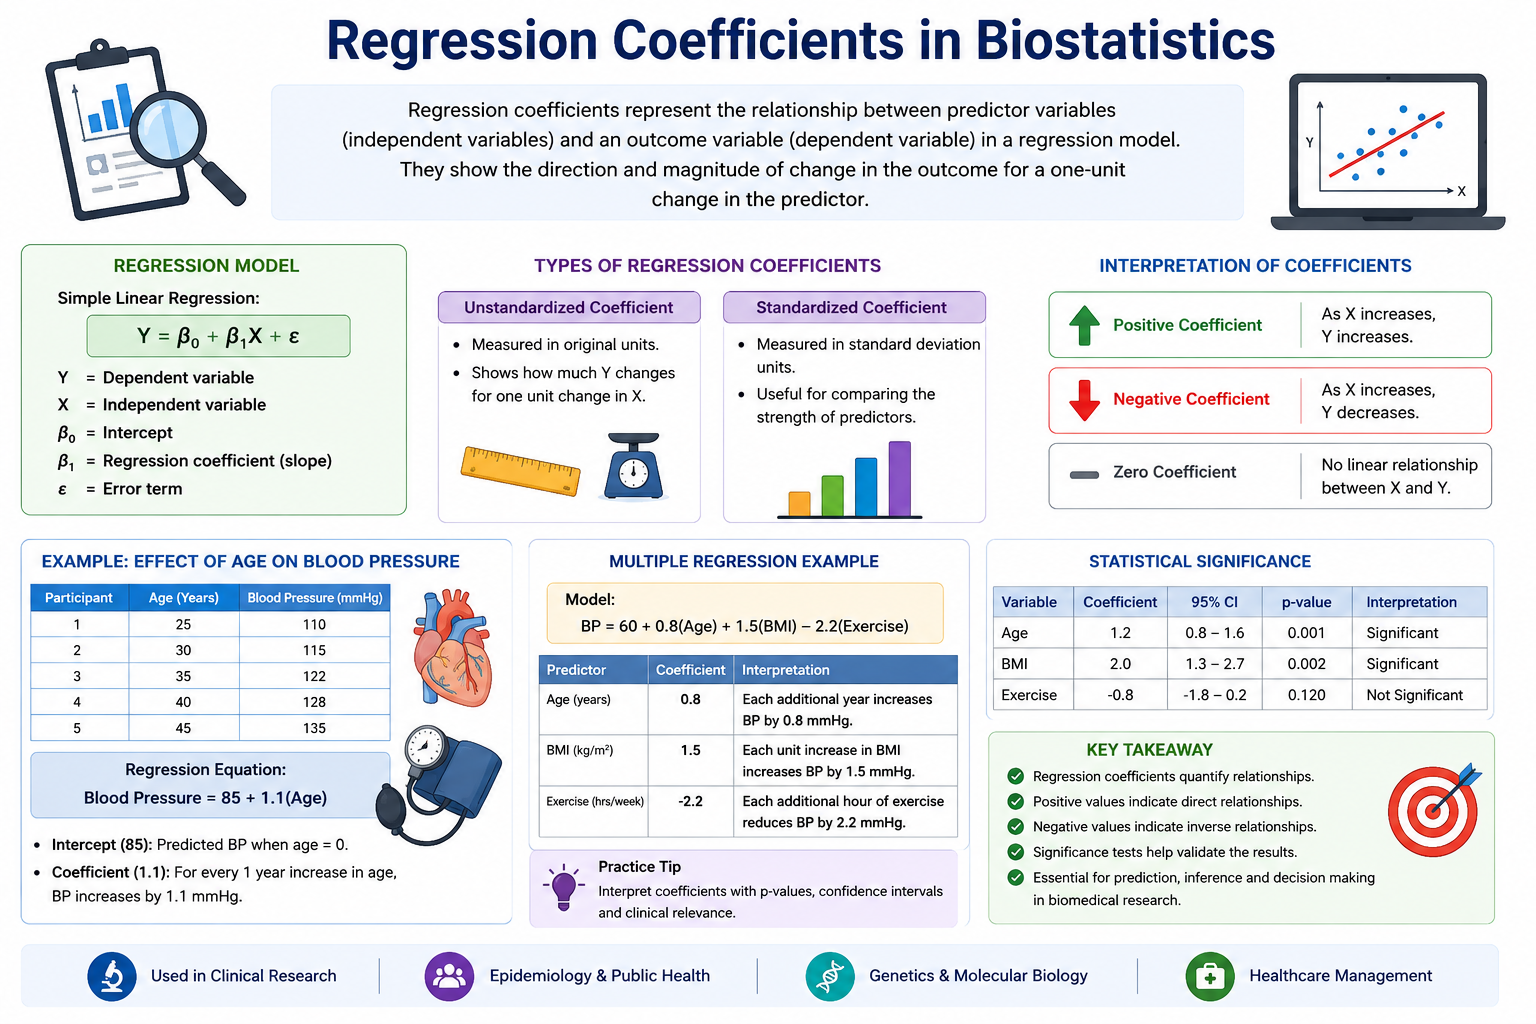
Multiple Regression in Biostatistics: Interpreting Systolic Blood Pressure Prediction Using MedCalc
Introduction In biostatistical research, understanding the simultaneous influence of multiple
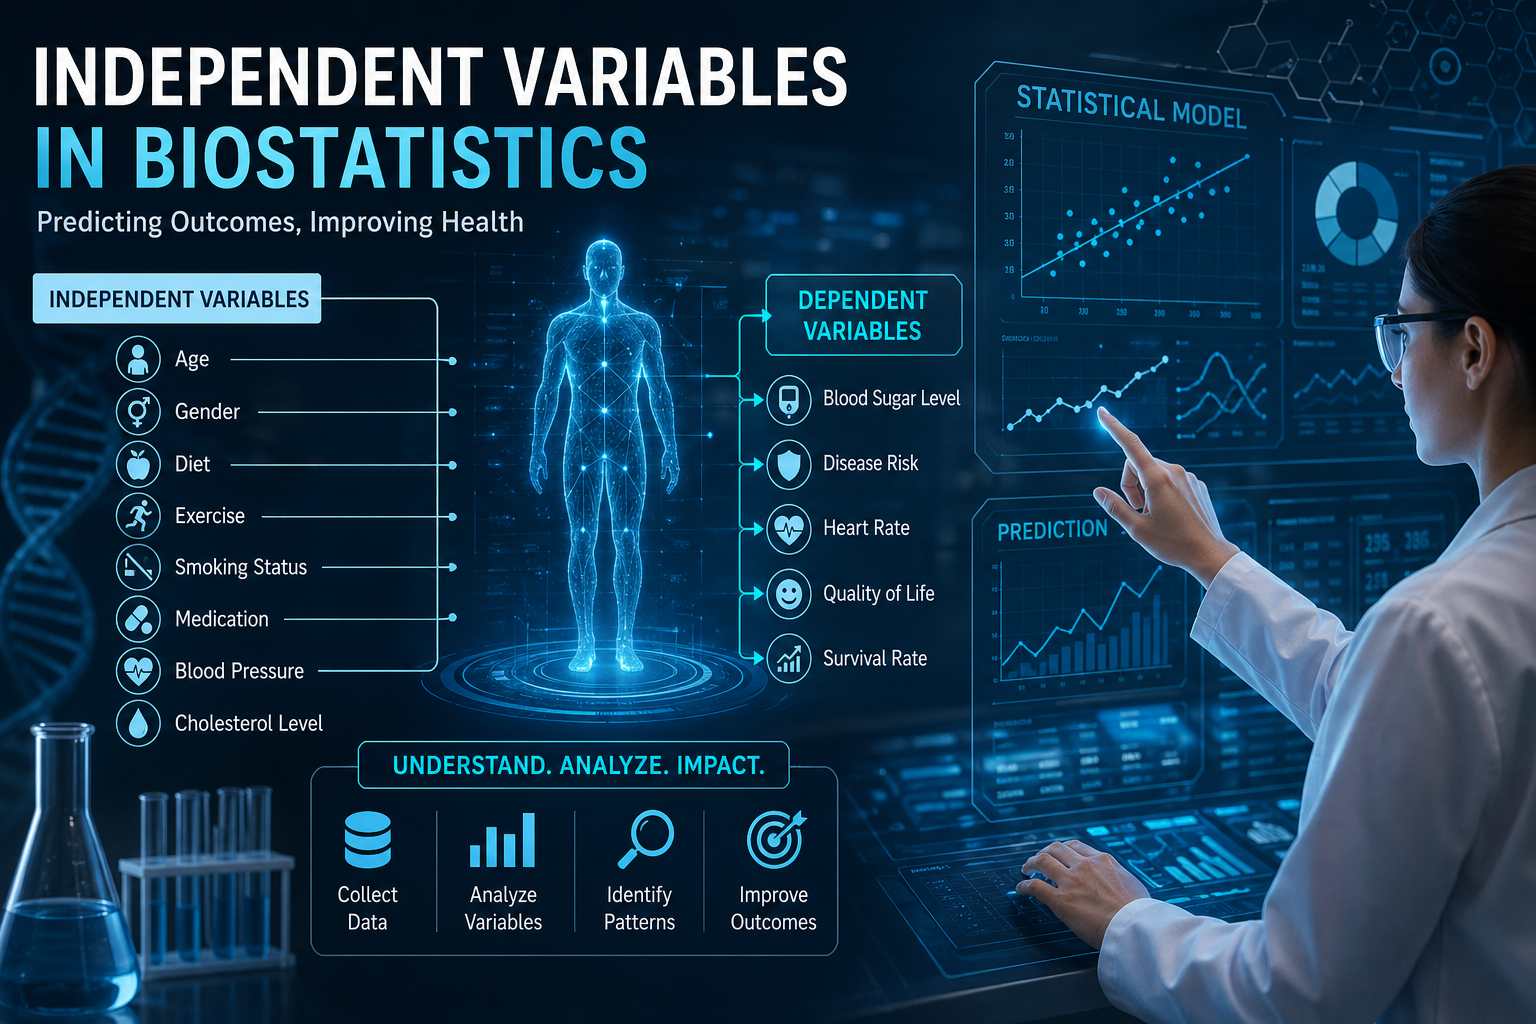
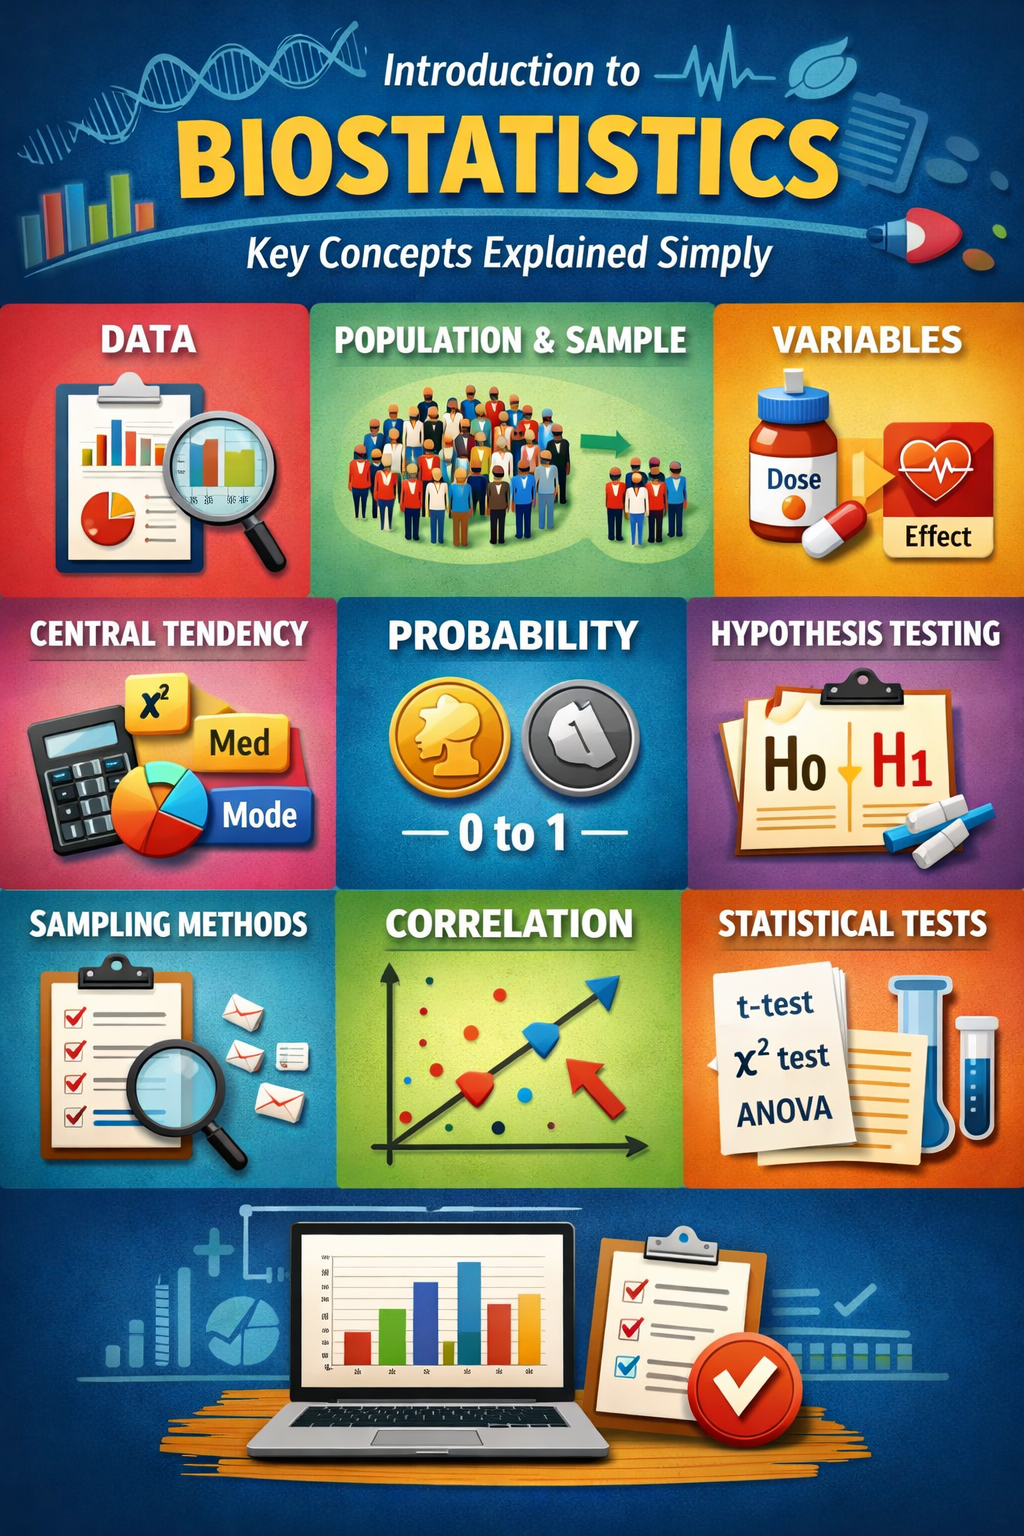
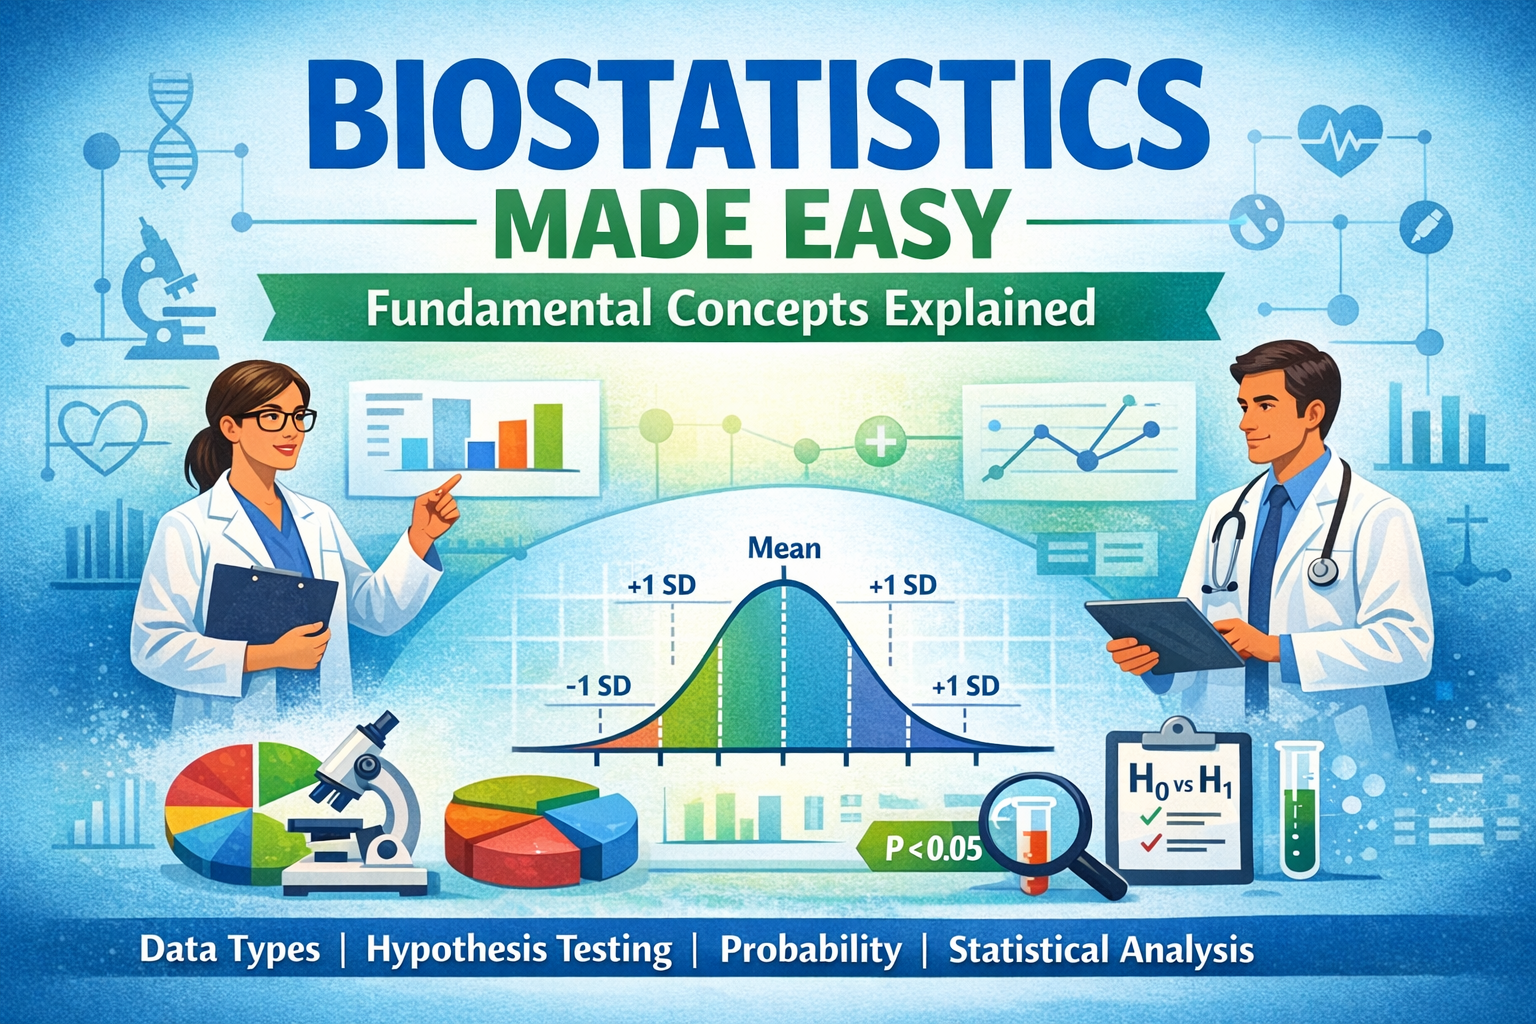
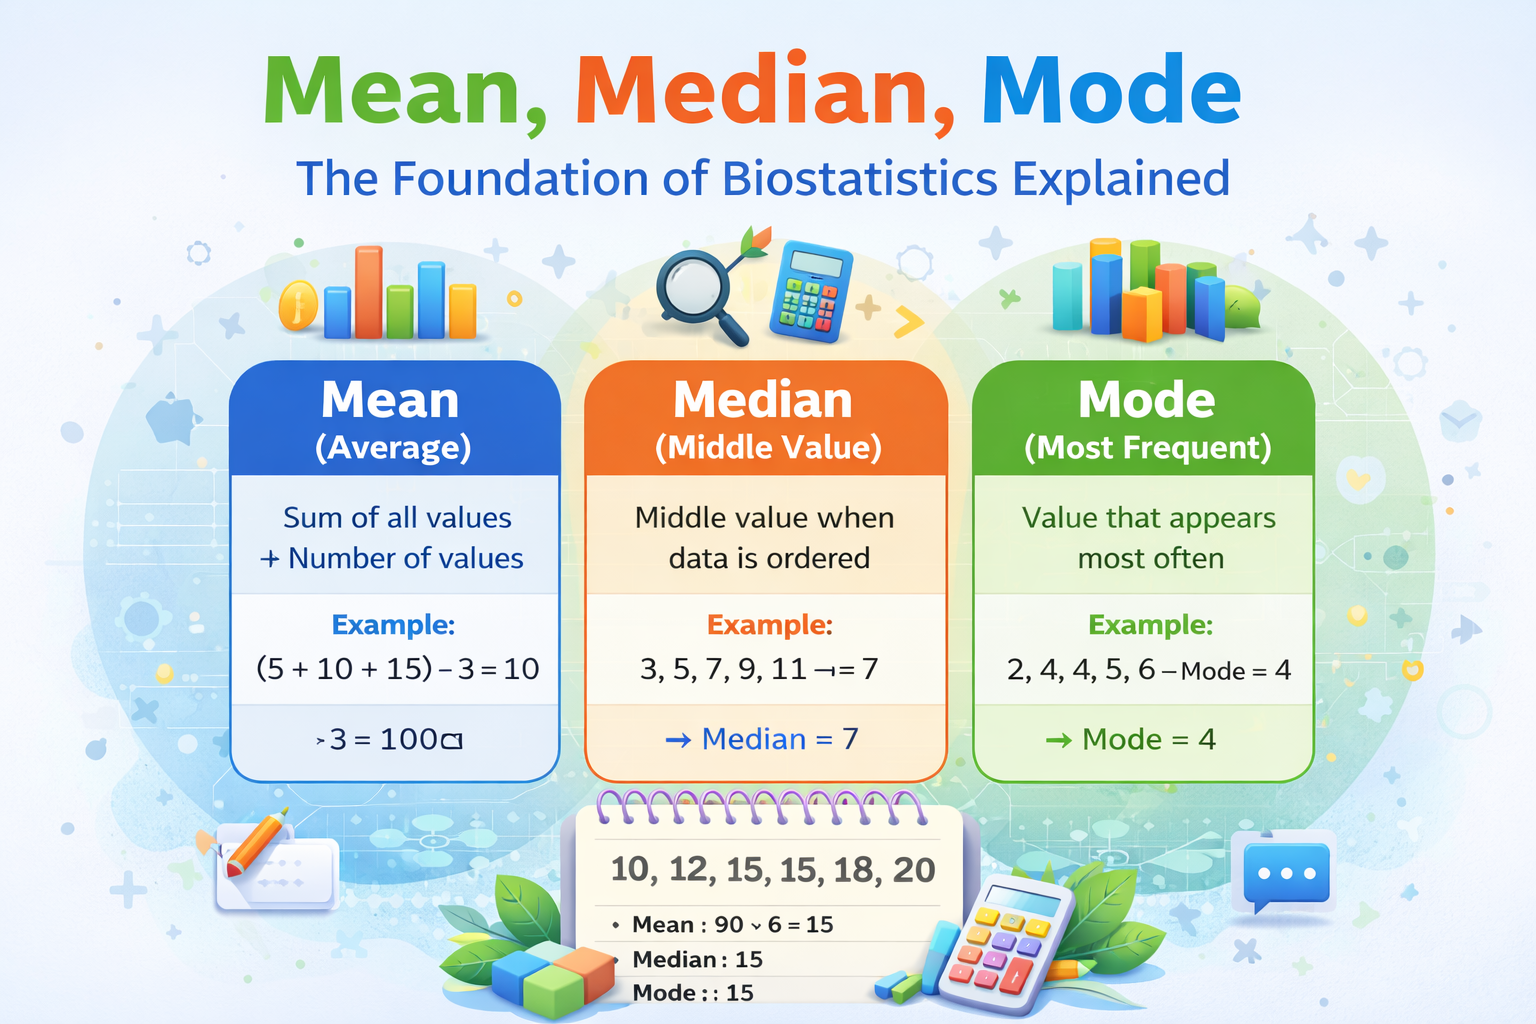
Basic Biostatistics for Beginners: A Complete Guide
Introduction Biostatistics is an essential branch of science that helps
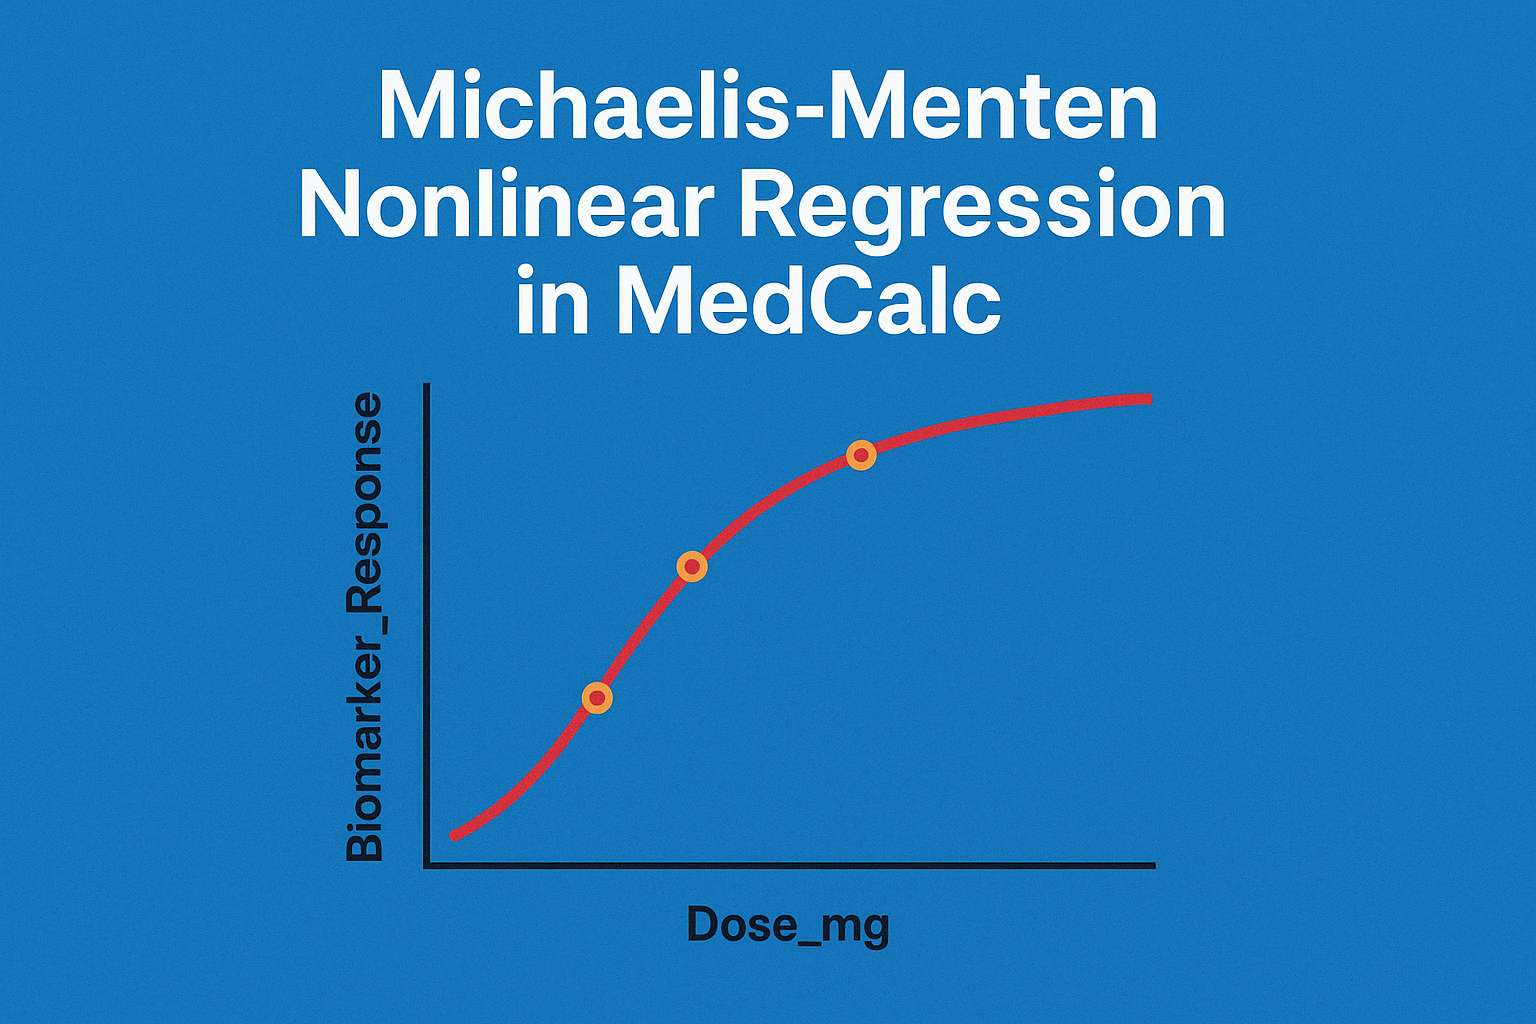
Michaelis–Menten Nonlinear Regression in MedCalc Using Real Biological Dose–Response Data
Introduction Nonlinear regression models are widely used in biostatistics to
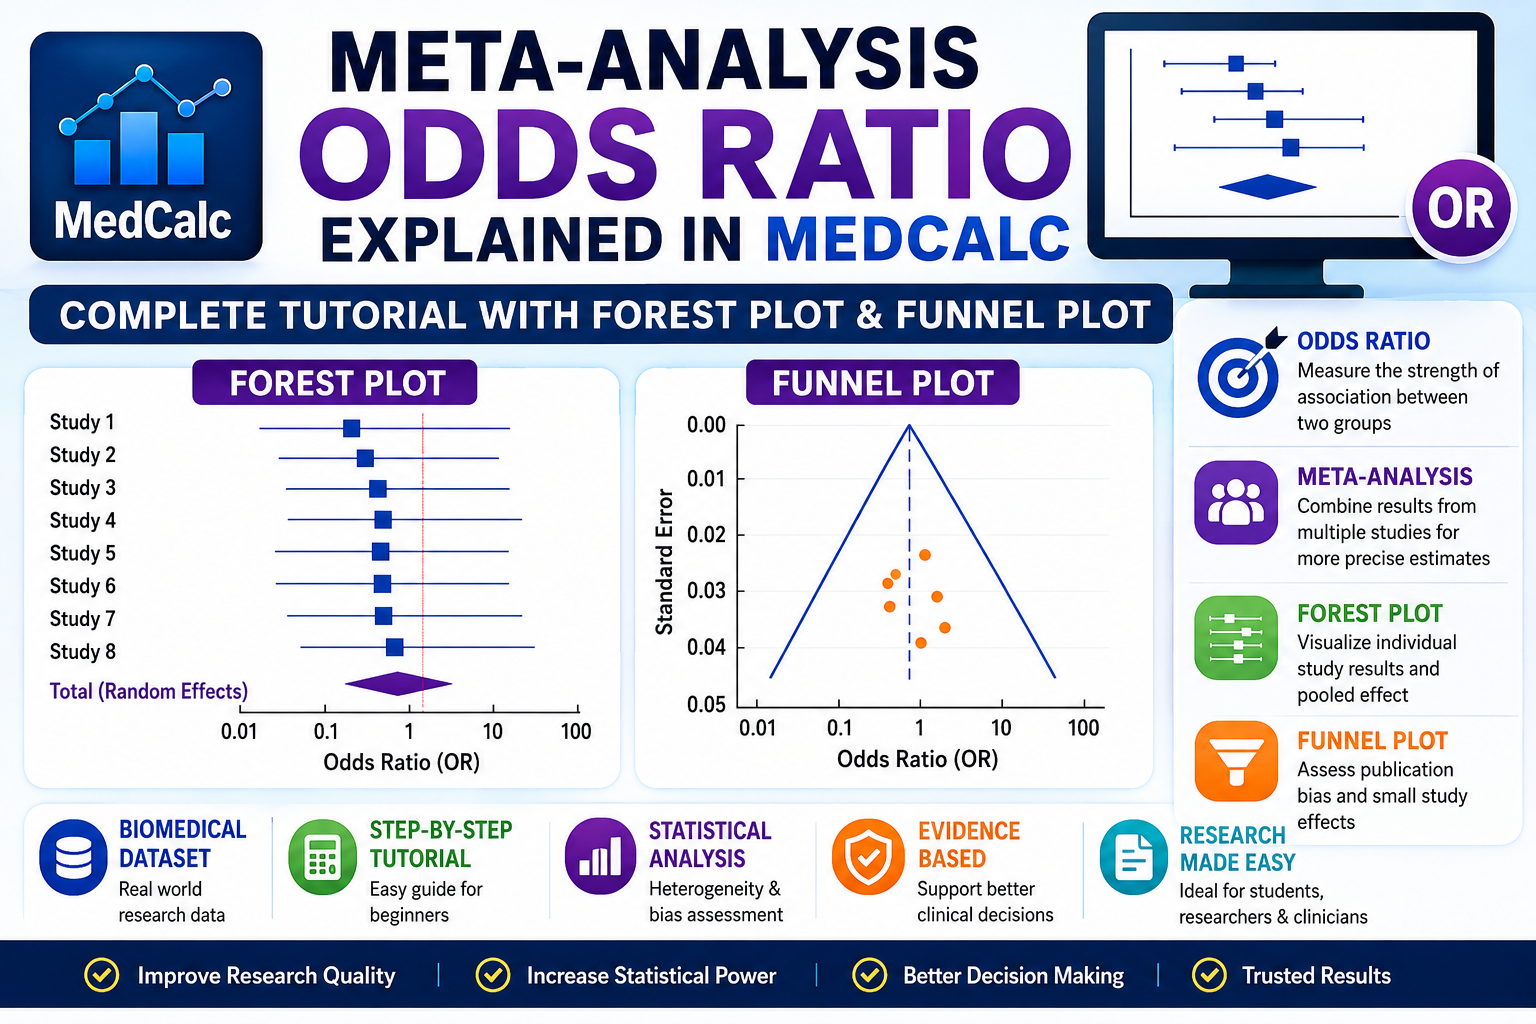
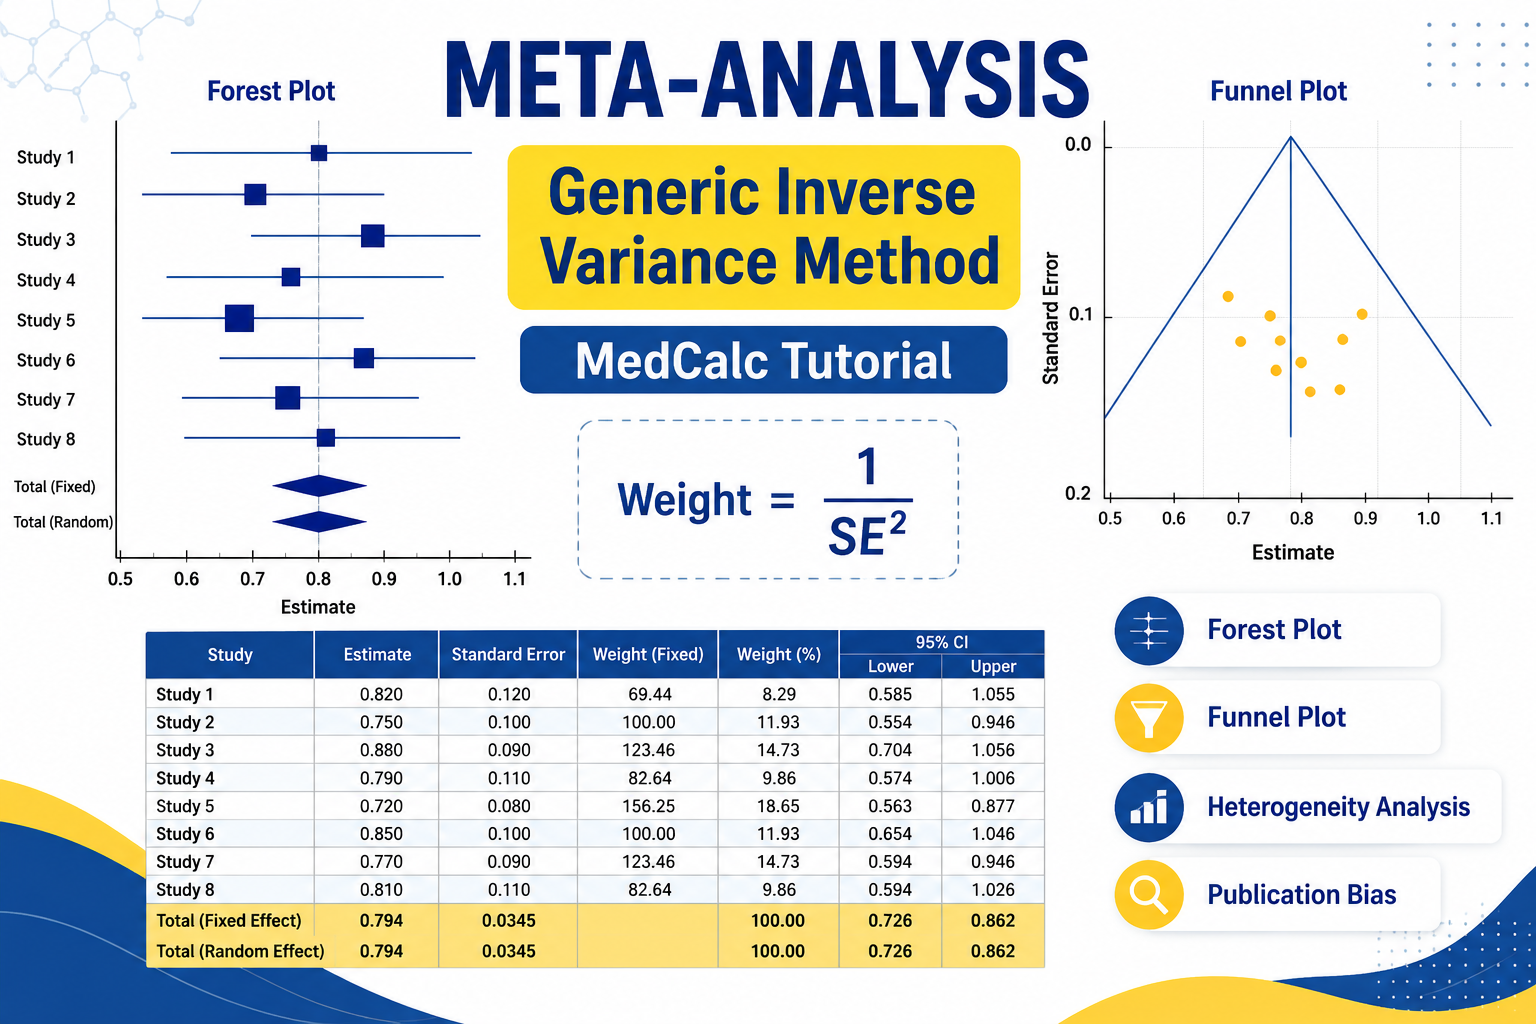
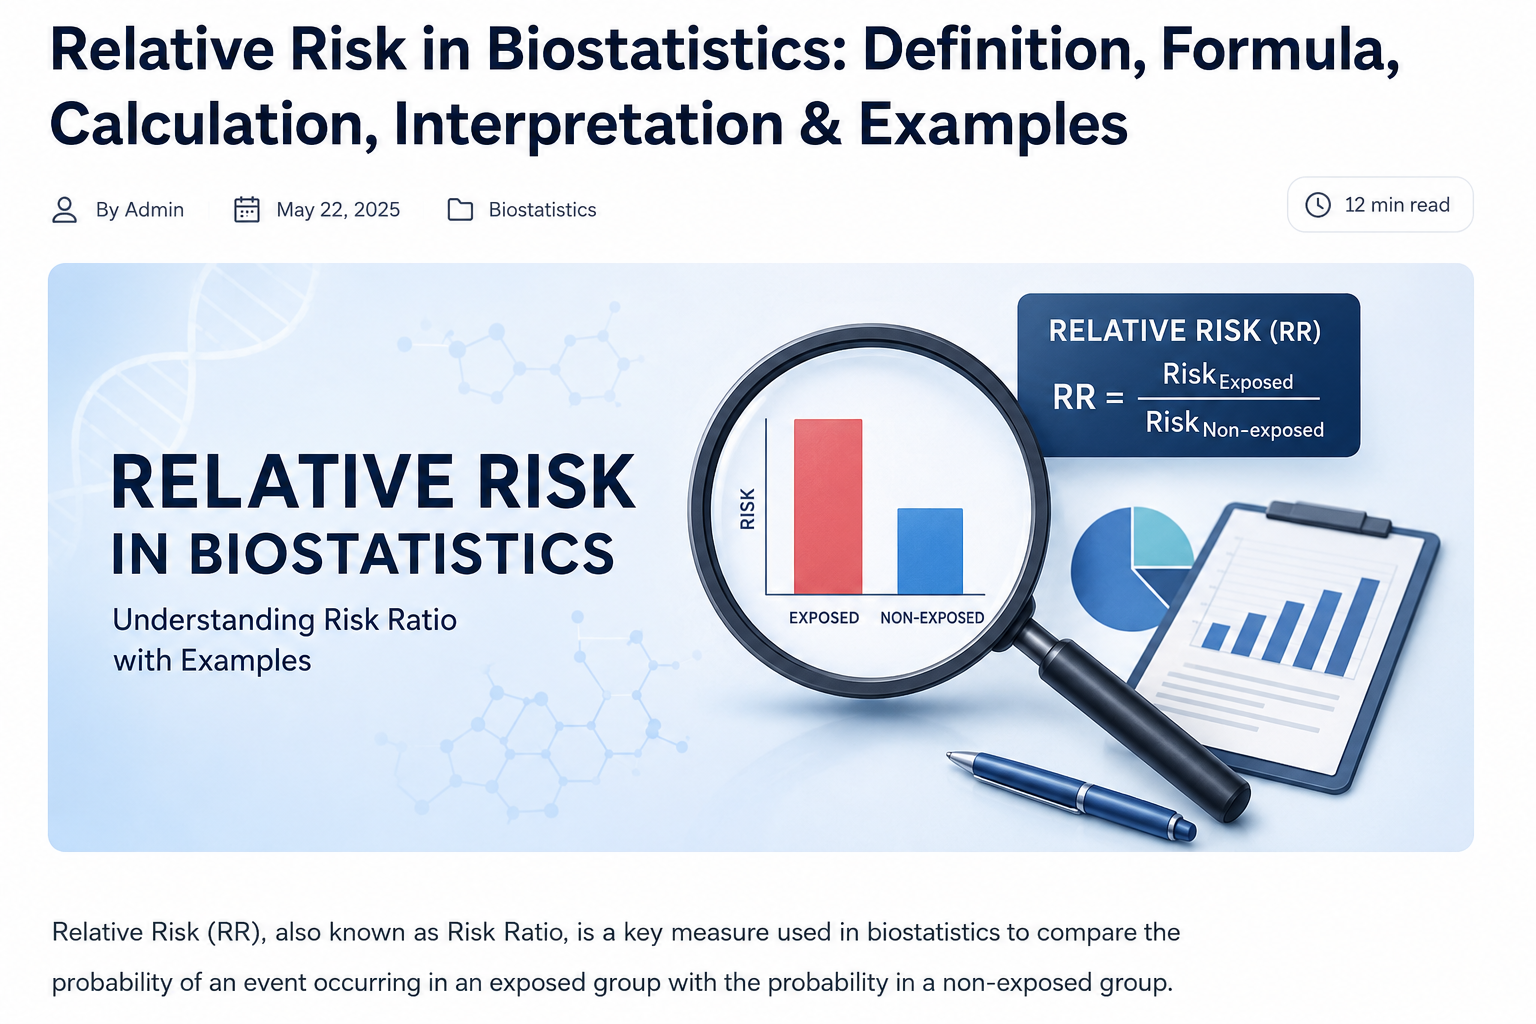
Meta-Analysis Odds Ratio Explained in MedCalc: Complete Tutorial with Forest Plot & Funnel Plot
Introduction Meta-analysis is a powerful statistical technique used to combine
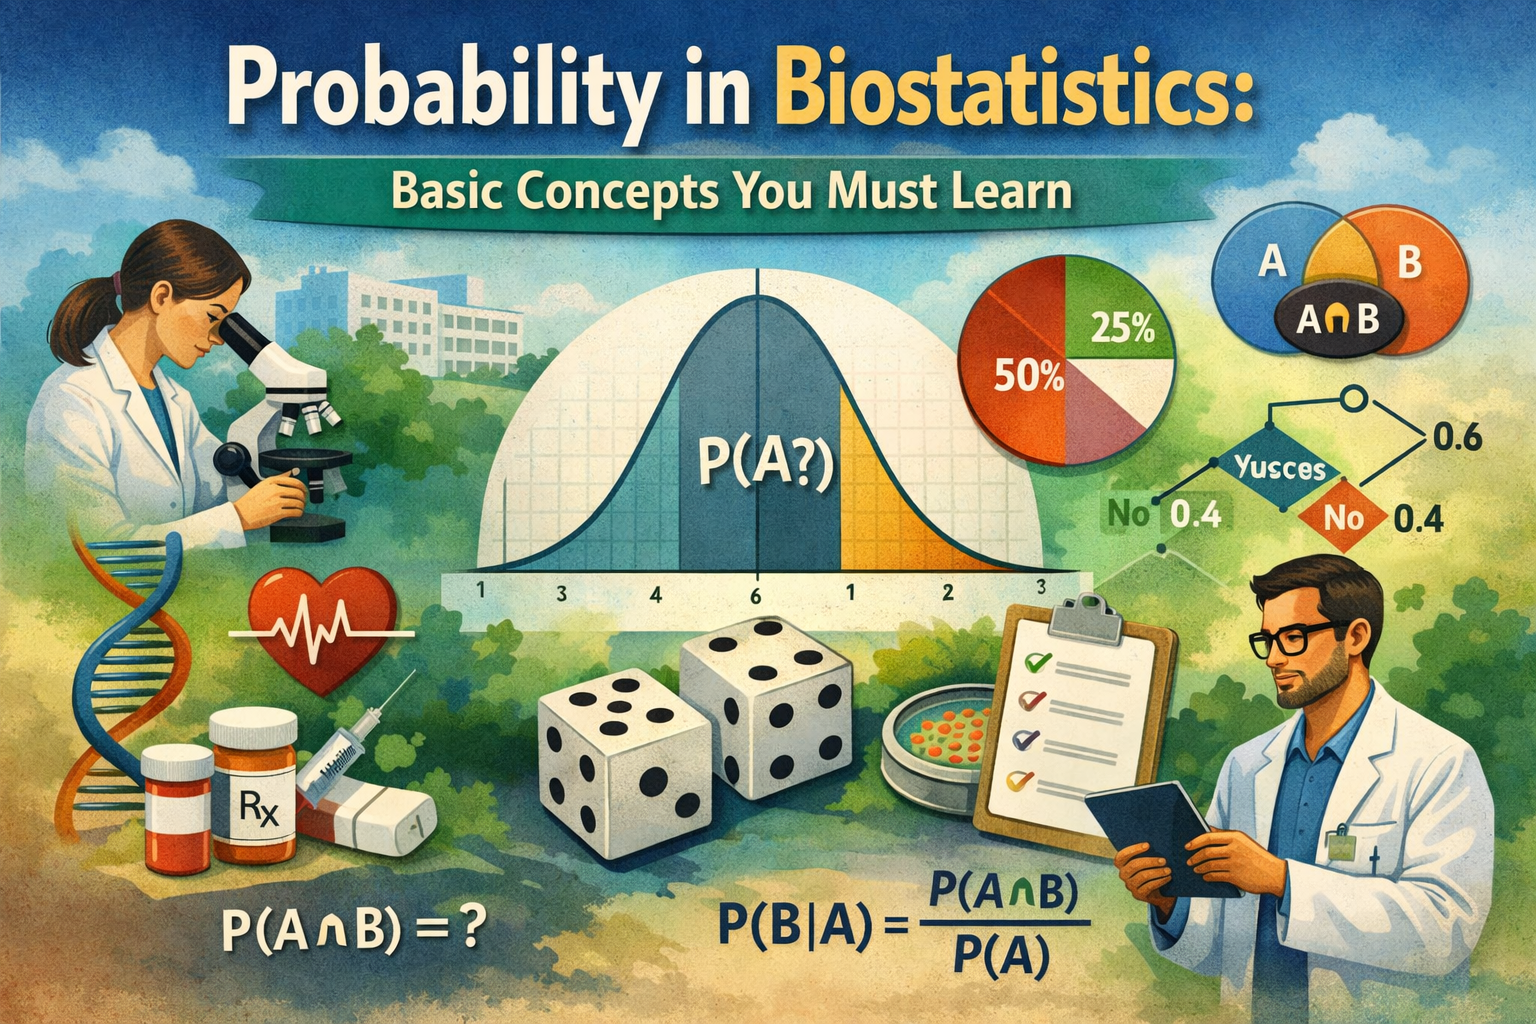
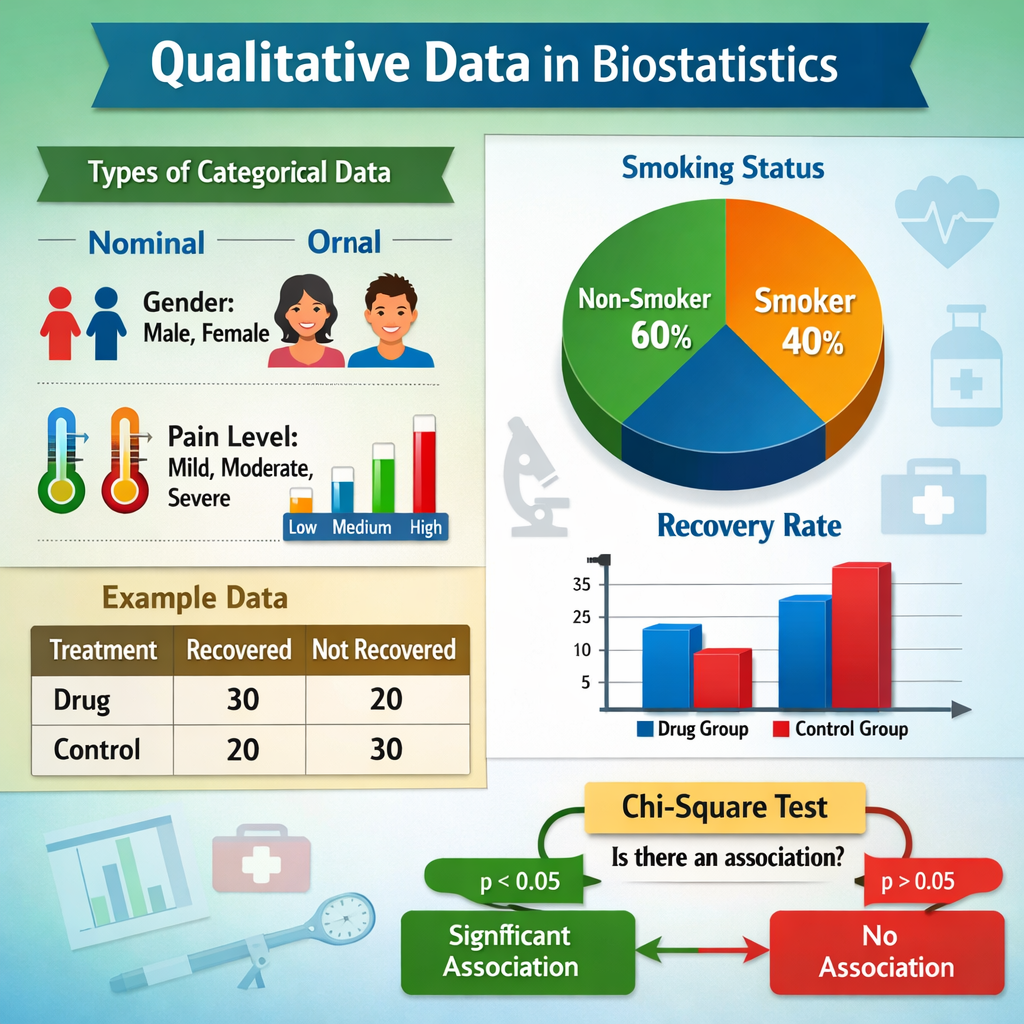
Random Variation in Biostatistics
Introduction In biological sciences and medical research, data rarely follow