Introduction
Biostatistics is the foundation of modern biological, medical, and public health research. It helps researchers and healthcare professionals analyze data, identify patterns, and make informed decisions. From understanding disease spread to evaluating treatment effectiveness, biostatistics plays a crucial role in improving human health.
In today’s data-driven world, learning biostatistics is essential for students, researchers, and professionals. This article simplifies key concepts to make them easy to understand.
Definition of Biostatistics
Biostatistics is a branch of statistics that deals with the collection, organization, analysis, and interpretation of biological and health-related data.
👉 In simple terms:
Biostatistics converts raw data into meaningful conclusions for decision-making in healthcare and research
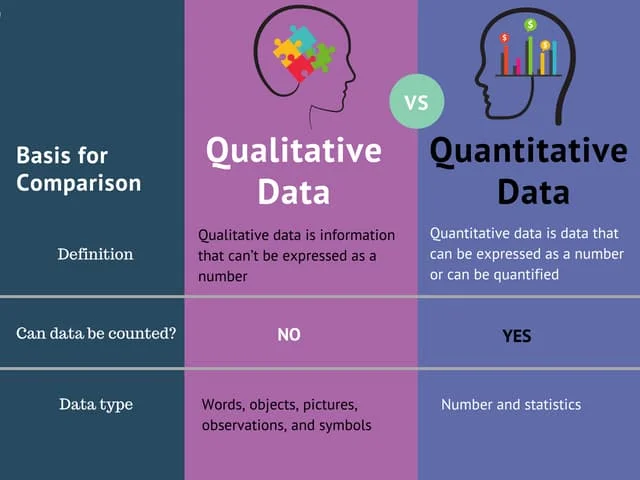
Data Types
Understanding data types is the first step in statistical analysis.
- Qualitative Data (Categorical): Non-numeric (e.g., gender, blood group)
- Quantitative Data (Numerical): Numeric values
- Discrete Data: Countable (e.g., number of patients)
- Continuous Data: Measurable (e.g., height, weight)
👉 Choosing the correct data type helps in selecting appropriate statistical metho
Measures of Central Tendency
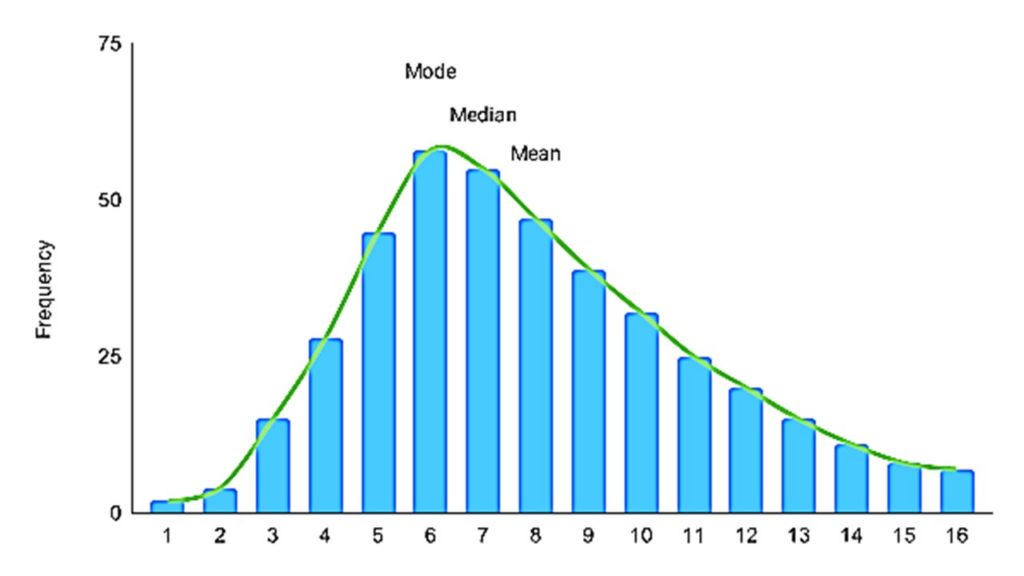
These measures describe the central value of a dataset.
- Mean: Average of all values
- Median: Middle value in ordered data
- Mode: Most frequent value
👉 These measures help summarize large datasets into a single representative value.
Measures of Dispersion
Dispersion indicates how spread out the data is.
- Range: Difference between maximum and minimum
- Variance: Average squared deviation from the mean
- Standard Deviation: Measure of variability
👉 Lower dispersion indicates more consistent data.
Probability
Probability measures the chance of an event occurring.
- Values range from 0 (impossible) to 1 (certain)
- Example: Probability of heads in a coin toss = 0.5
👉 Probability forms the basis of statistical inference.

Sampling Techniques
Sampling involves selecting a subset of a population.
- Random Sampling: Equal chance for all individuals
- Stratified Sampling: Population divided into groups
- Systematic Sampling: Selection at regular intervals
👉 Proper sampling ensures reliable and unbiased results.
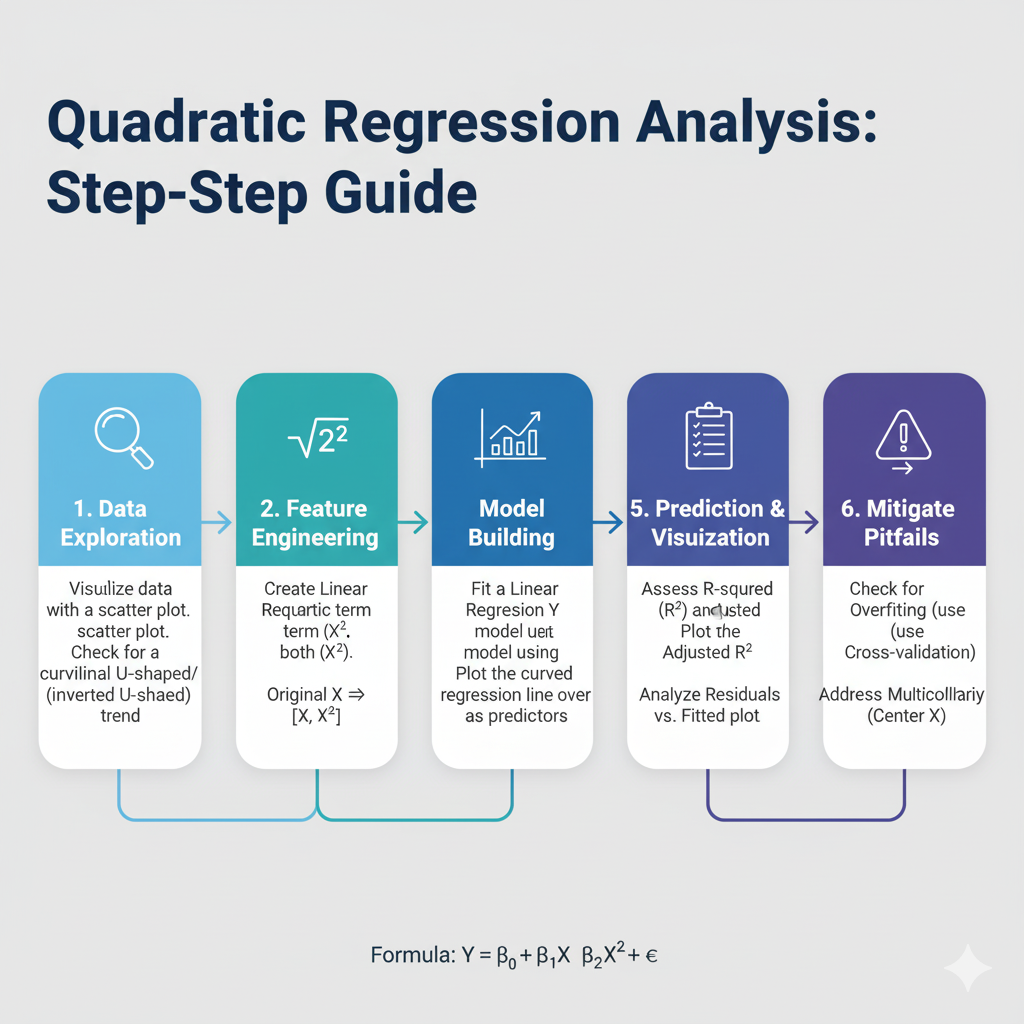
Hypothesis Testing
Hypothesis testing determines whether results are significant.
- Null Hypothesis (H₀): No effect
- Alternative Hypothesis (H₁): There is an effect
👉 It helps validate research findings scientifically.
Step-by-Step Biostatistical Process
- Define the Problem
Example: Does a drug reduce blood pressure? - Collect Data
Gather data through experiments or surveys - Organize Data
Use tables or charts - Analyze Data
Apply statistical methods - Interpret Results
Understand outcomes - Draw Conclusions
Make decisions based on evidence
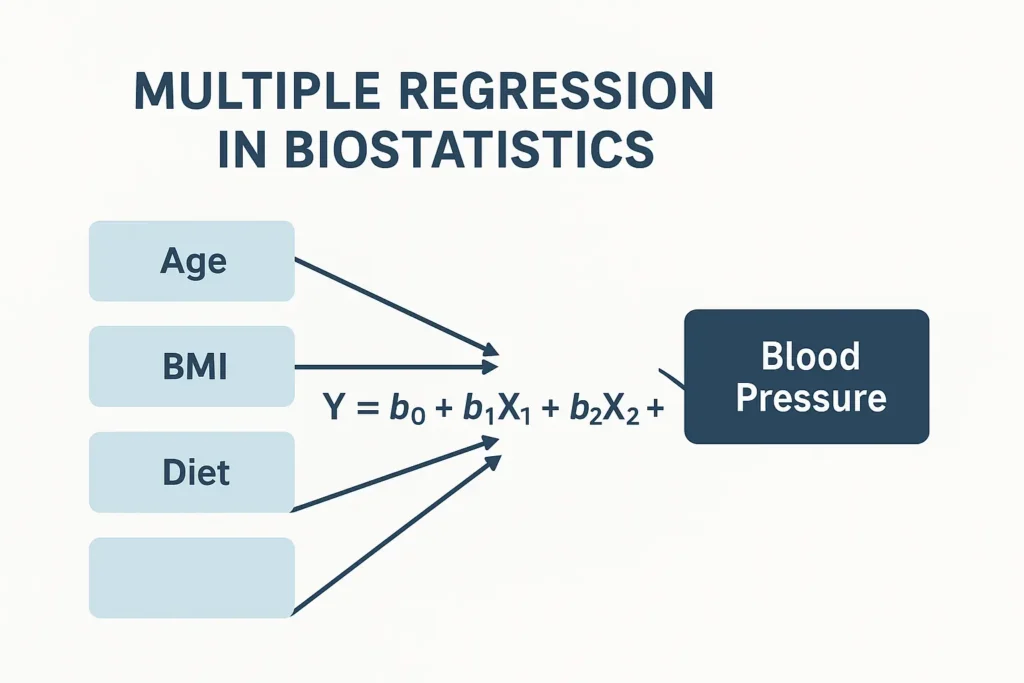
Example of Biostatistics in Action
Scenario
A researcher studies the effect of a drug on blood pressure.
Data (mmHg reduction)
12, 15, 10, 18, 14, 16, 11, 13, 17, 15
Step 1: Mean
Mean = 14.1
Step 2: Interpretation
The average reduction suggests improvement.
Step 3: Hypothesis Testing
If p-value < 0.05 → statistically significant
👉 Conclusion: The drug is effective in reducing blood pressure.
Importance of Biostatistics
Supports medical research
Helps in disease prevention
Improves healthcare decisions
Enables evidence-based practice
Conclusion
Biostatistics simplifies complex biological data into understandable information. By learning fundamental concepts such as data types, central tendency, dispersion, probability, sampling, and hypothesis testing, anyone can begin analyzing and interpreting scientific data.
Mastering these basics not only enhances academic knowledge but also strengthens research and professional skills in healthcare and life sciences.