
Introduction
In medical research and epidemiology, understanding the relationship between exposure and disease is crucial. Two of the most widely used statistical measures for this purpose are Relative Risk (RR) and Odds Ratio (OR). These measures help researchers determine whether exposure to a particular factor—such as smoking—increases or decreases the likelihood of developing a disease.
In this article, we will explore the concepts of Relative Risk and Odds Ratio in detail using MedCalc analysis results, including step-by-step calculations, interpretation, and visualization. The dataset used here compares smokers and non-smokers with respect to disease occurrence.
📂 Data Source
The dataset used for this analysis can be downloaded from the link provided below
Definition
Relative Risk (RR)
Relative Risk is the ratio of the probability of an event occurring in the exposed group to the probability in the non-exposed group.
👉 Formula:
RR = Risk in Exposed / Risk in Non-Exposed
Odds Ratio (OR)
Odds Ratio compares the odds of an event occurring in one group to the odds in another group.
👉 Formula:
OR = (a × d) / (b × c)
Concept Explanation
- RR = 1 → No association
- RR > 1 → Increased risk (harmful exposure)
- RR < 1 → Protective effect
- OR = 1 → No association
- OR > 1 → Higher odds of disease
- OR < 1 → Lower odds of disease
Data Used in This Study
| Outcome | Non-Smoker | Smoker | Total |
|---|---|---|---|
| No Disease | 7 | 3 | 10 |
| Disease | 3 | 7 | 10 |
| Total | 10 | 10 | 20 |
Step-by-Step Calculation
Step 1: Calculate Risk
- Risk in smokers = 7 / 10 = 0.7
- Risk in non-smokers = 3 / 10 = 0.3
Step 2: Relative Risk
RR = 0.7 / 0.3 = 2.33
Step 3: Odds Calculation
- Odds in smokers = 7 / 3 = 2.33
- Odds in non-smokers = 3 / 7 = 0.43
Step 4: Odds Ratio
OR = (7 × 7) / (3 × 3) = 49 / 9 = 5.44
MedCalc Results Summary
From your uploaded MedCalc output:
Relative Risk
- RR = 2.3333
- 95% CI = 0.8330 to 6.5362
- P-value = 0.1069
Odds Ratio
- OR = 5.4444
- 95% CI = 0.8040 to 36.8686
- P-value = 0.0825
Result Interpretation
Relative Risk Interpretation
- Smokers have 2.33 times higher risk of developing disease compared to non-smokers.
- However, confidence interval includes 1, meaning:
❗ Result is not statistically significant
Odds Ratio Interpretation
- Smokers have 5.44 times higher odds of disease.
- Again, CI includes 1 → Not statistically significant
P-value Interpretation
- RR → p = 0.1069
- OR → p = 0.0825
👉 Since p > 0.05, results are not significant, but show a strong trend
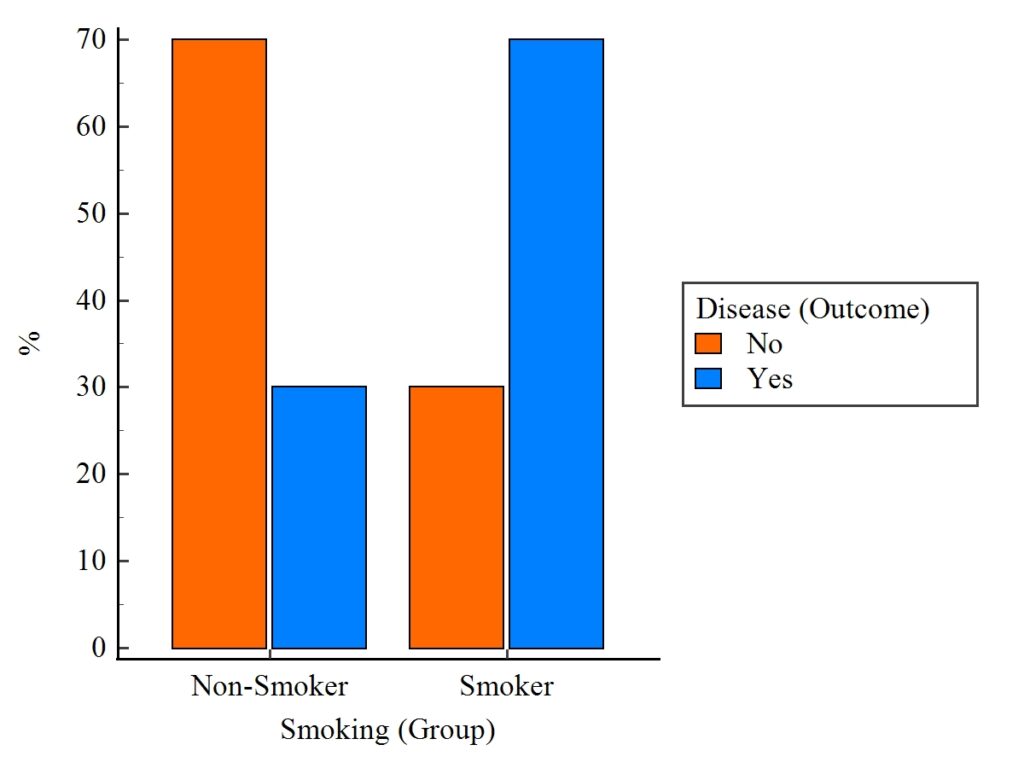
Plot Interpretation
From the given bar chart:
- Non-smokers:
- 70% → No disease
- 30% → Disease
- Smokers:
- 30% → No disease
- 70% → Disease
👉 This clearly shows:
- Disease prevalence is higher in smokers
- Non-smokers show protective effect
Even though statistical significance is not achieved, the visual trend strongly supports association
Result Table
You can present your results like this in research papers:
| Measure | Value | 95% CI | P-value | Interpretation |
|---|---|---|---|---|
| Relative Risk | 2.33 | 0.83 – 6.53 | 0.1069 | Increased risk, not significant |
| Odds Ratio | 5.44 | 0.80 – 36.86 | 0.0825 | Strong association, not significant |
When to Use RR vs OR
| Situation | Use |
|---|---|
| Cohort study | Relative Risk |
| Case-control study | Odds Ratio |
| Rare disease | OR ≈ RR |
| Clinical trials | RR preferred |
Important Notes
- Small sample size (n = 20) affects significance
- Wide confidence interval → less precision
- Larger sample → better accuracy
Conclusion
This study demonstrates the application of Relative Risk and Odds Ratio using MedCalc software in evaluating the relationship between smoking and disease occurrence.
Key findings:
- Smokers show higher risk (RR = 2.33)
- Odds of disease are much higher (OR = 5.44)
- However, results are not statistically significant due to small sample size
Despite this, both numerical and graphical analysis indicate a strong positive association between smoking and disease.
👉 Future studies with larger sample sizes are recommended to confirm statistical significance


