Introduction
Biostatistics is one of the most important tools in modern science, especially in fields like biology, medicine, public health, and environmental science. Whether it is analyzing the effectiveness of a new drug, understanding disease patterns, or studying population growth, biostatistics plays a crucial role.
In simple terms, biostatistics helps researchers make sense of data related to living organisms. Without proper statistical analysis, scientific conclusions would be unreliable and often misleading.
This article provides a clear and simple introduction to biostatistics, covering its definition, key concepts, step-by-step explanations, and real-life examples to help beginners understand the subject easily.
Definition of Biostatistics
Biostatistics can be defined as:
“The application of statistical methods to biological, medical, and health-related data.”
It involves collecting, organizing, analyzing, and interpreting data to draw meaningful conclusions in life sciences.
Why is Biostatistics Important?
Biostatistics is essential because it helps in:
- Making decisions based on data rather than assumptions
- Designing scientific experiments properly
- Understanding variability in biological systems
- Testing hypotheses in research
- Improving public health policies
For example, during a disease outbreak, biostatistics helps determine how fast the disease spreads and how effective treatments are.
Key Concepts of Biostatistics (Step-by-Step Explanation)
1. Data
Data is the foundation of biostatistics. It refers to collected information.
Types of Data:
- Qualitative Data: Descriptive (e.g., gender, blood group)
- Quantitative Data: Numerical (e.g., height, weight, age)
Example:
Recording the weights of 50 patients in a hospital.
2. Population and Sample
- Population: Entire group of interest
- Sample: A subset of the population
Since studying the whole population is often difficult, researchers use samples.
Example:
Population = All people in Tamil Nadu
Sample = 500 selected individuals for a study
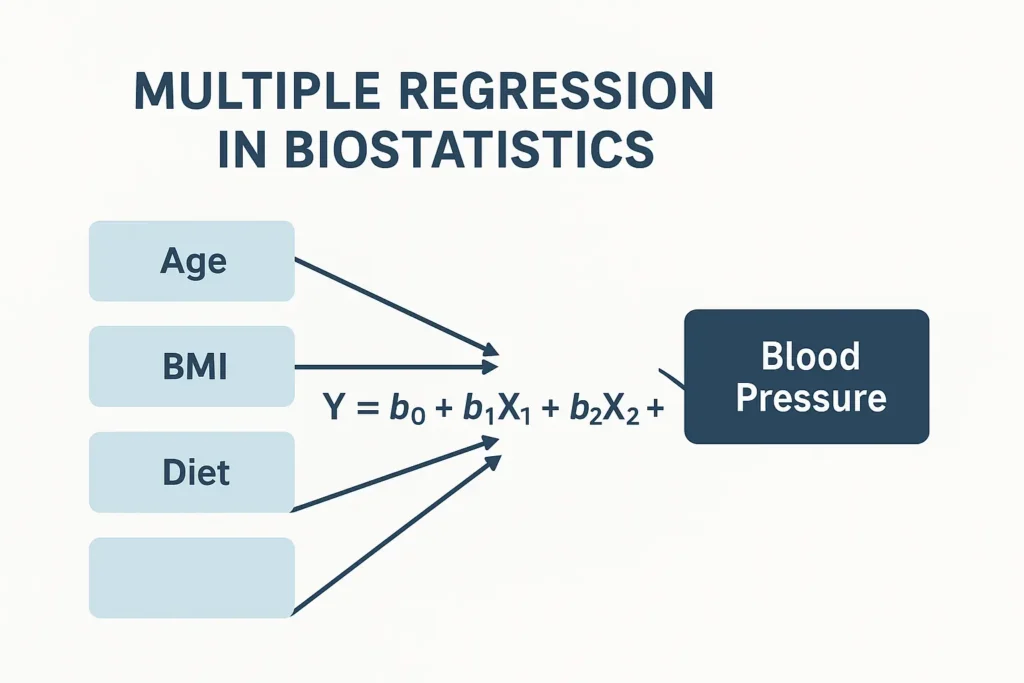
3. Variables
A variable is any characteristic that can change.
Types of Variables:
- Independent Variable: Cause (e.g., drug dosage)
- Dependent Variable: Effect (e.g., recovery rate)
4. Measures of Central Tendency
These describe the center of data.
- Mean: Average value
- Median: Middle value
- Mode: Most frequent value
Example:
Data: 2, 4, 6, 8, 10
Mean = 6
5. Measures of Dispersion
These show how spread out the data is.
- Range: Difference between highest and lowest
- Variance: Spread of data points
- Standard Deviation: Average deviation from mean
6. Probability
Probability measures the chance of an event occurring.
- Value ranges from 0 to 1
- 0 = impossible event
- 1 = certain event
Example:
Probability of getting a head in a coin toss = 0.5
7. Hypothesis Testing
A hypothesis is an assumption made for testing.
- Null Hypothesis (H₀): No effect
- Alternative Hypothesis (H₁): There is an effect
Researchers test whether to accept or reject the null hypothesis.
8. Sampling Methods
Sampling ensures data represents the population.
Types:
- Random sampling
- Systematic sampling
- Stratified sampling
Proper sampling reduces bias.
9. Correlation
Correlation shows the relationship between two variables.
- Positive correlation
- Negative correlation
- No correlation
Example:
Exercise vs health improvement
10. Statistical Tests
Common tests include:
- t-test: Compare two groups
- Chi-square test: Categorical data analysis
- ANOVA: Compare multiple groups
Step-by-Step Process in Biostatistics
Biostatistical analysis usually follows these steps:
Step 1: Define the Problem
Identify what you want to study.
Step 2: Collect Data
Gather relevant and accurate data.
Step 3: Organize Data
Use tables, charts, or graphs.
Step 4: Analyze Data
Apply statistical methods.
Step 5: Interpret Results
Draw conclusions from analysis.
Step 6: Make Decisions
Use results for real-world applications.
Real-Life Example of Biostatistics
Let’s consider a simple example:
Study:
Effect of a new drug on reducing fever.
Step 1:
Select 100 patients with fever.
Step 2:
Divide into two groups:
- Group A: Given new drug
- Group B: Given standard drug
Step 3:
Record temperature reduction.
Step 4:
Calculate average reduction.
Step 5:
Apply statistical test (t-test).
Step 6:
Conclusion:
If Group A shows significantly better results, the new drug is effective.
Applications of Biostatistics
Biostatistics is widely used in:
- Medical research
- Clinical trials
- Epidemiology
- Genetics
- Environmental studies
- Public health planning
For example, vaccine effectiveness studies rely heavily on biostatistics.
Advantages of Biostatistics
- Provides scientific accuracy
- Helps in decision-making
- Reduces uncertainty
- Improves research quality
- Supports evidence-based medicine
Limitations of Biostatistics
- Requires proper data collection
- Misuse can lead to wrong conclusions
- Needs statistical knowledge
- Cannot replace human judgment
Conclusion
Biostatistics is a powerful tool that connects mathematics with biology and medicine. It helps researchers understand data, identify patterns, and make informed decisions. From disease control to drug development, biostatistics plays a critical role in improving human health.
By learning the basic concepts such as data, variables, probability, and hypothesis testing, beginners can build a strong foundation in this subject. With practice and real-world application, biostatistics becomes an essential skill for anyone involved in life sciences and research.