

Frequencies Bar Chart in MedCalc: Complete Guide with Example
Introduction In biomedical research and clinical data analysis, understanding how categorical variables are distributed is essential. One of the simplest […]
Introduction In biomedical research and clinical data analysis, understanding how categorical variables are distributed is essential. One of the simplest […]
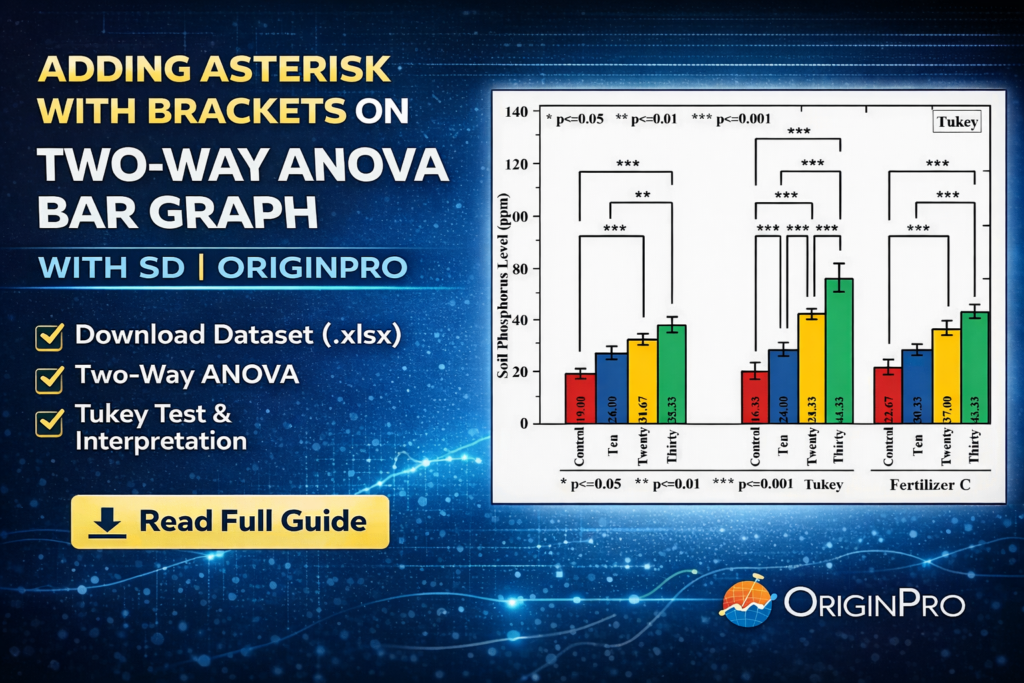
Introduction Data visualization plays a crucial role in biostatistics, especially when interpreting complex statistical analyses such as Two-Way ANOVA. When
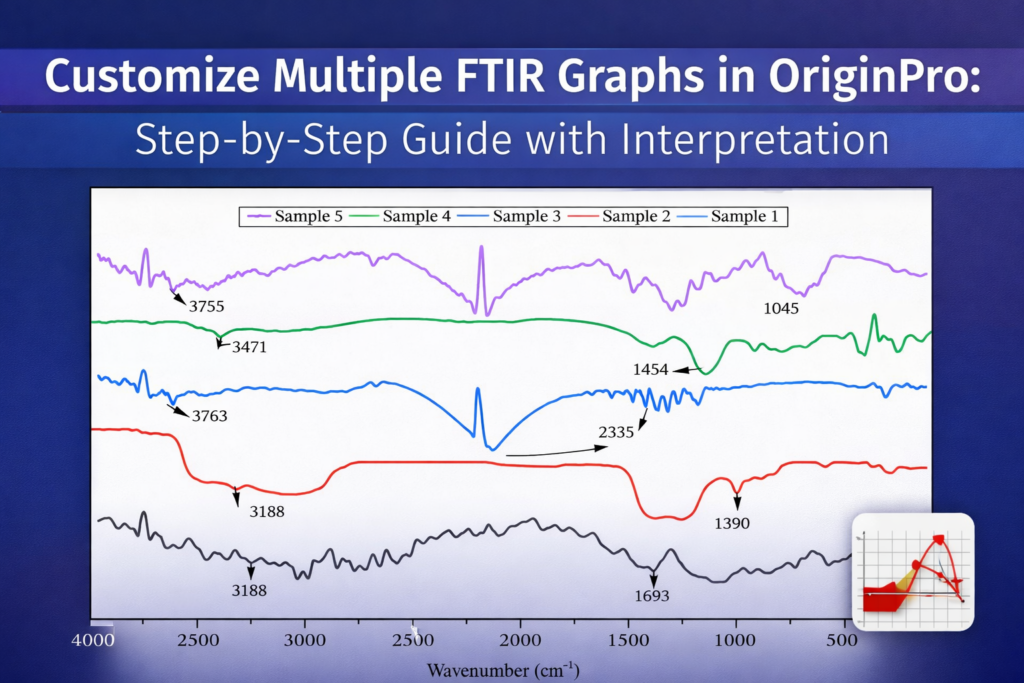
Introduction Fourier Transform Infrared (FTIR) spectroscopy is one of the most widely used analytical techniques for identifying functional groups and
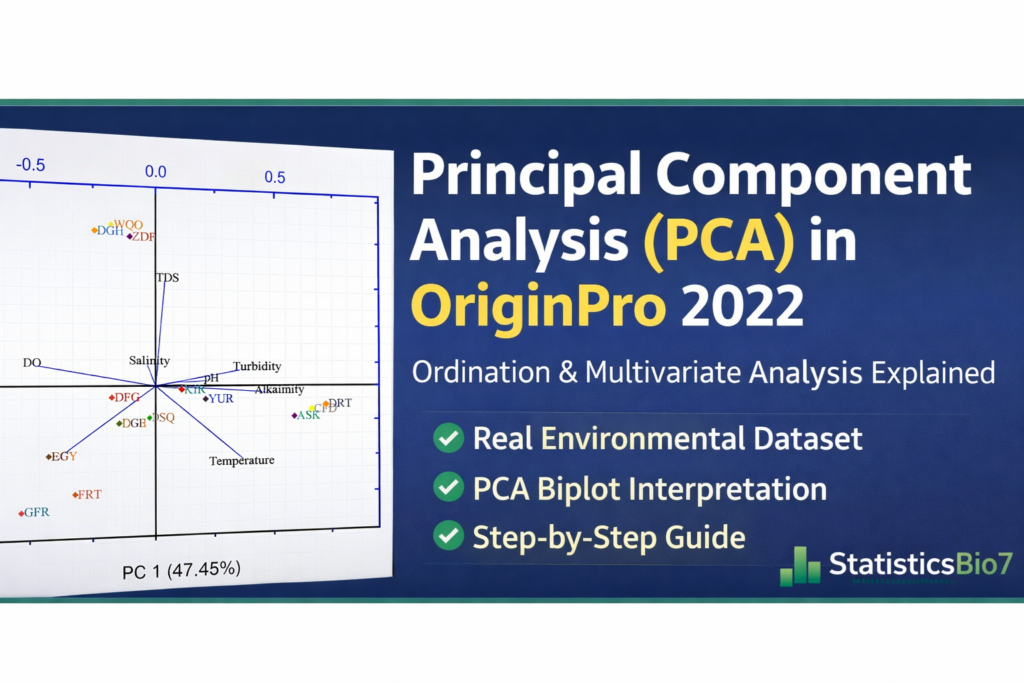
Introduction Multivariate datasets are common in biological, environmental, and ecological research. When several variables are measured simultaneously, understanding relationships between

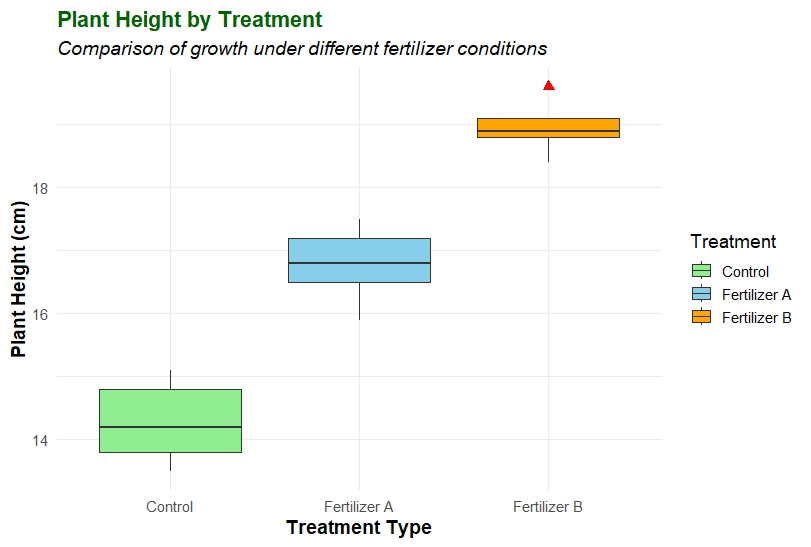
Introduction Data visualization is one of the most essential steps in biological research, ecological monitoring, agricultural experiments, and medical studies.
Introduction In biostatistics and data analysis, visualizing the distribution of a dataset is one of the first steps toward understanding

Introduction In biostatistics, data visualization is more than just creating charts—it’s about transforming complex datasets into clear, meaningful insights that