Introduction
Biostatistics is one of the most important tools in biological, medical, agricultural, environmental, and public health research. It helps researchers collect, organize, analyze, interpret, and present data in a meaningful way. Without a proper understanding of basic biostatistical concepts, researchers may misinterpret results, draw incorrect conclusions, and make poor scientific decisions.
Many students begin learning statistical software such as SPSS, R, GraphPad Prism, OriginPro, or MedCalc without understanding the fundamental principles behind the analyses. However, knowing the underlying concepts is more important than simply clicking buttons in software.
This article introduces the most essential biostatistics concepts that every student, researcher, and life science professional should understand before conducting any statistical analysis.
What is Biostatistics?
Definition
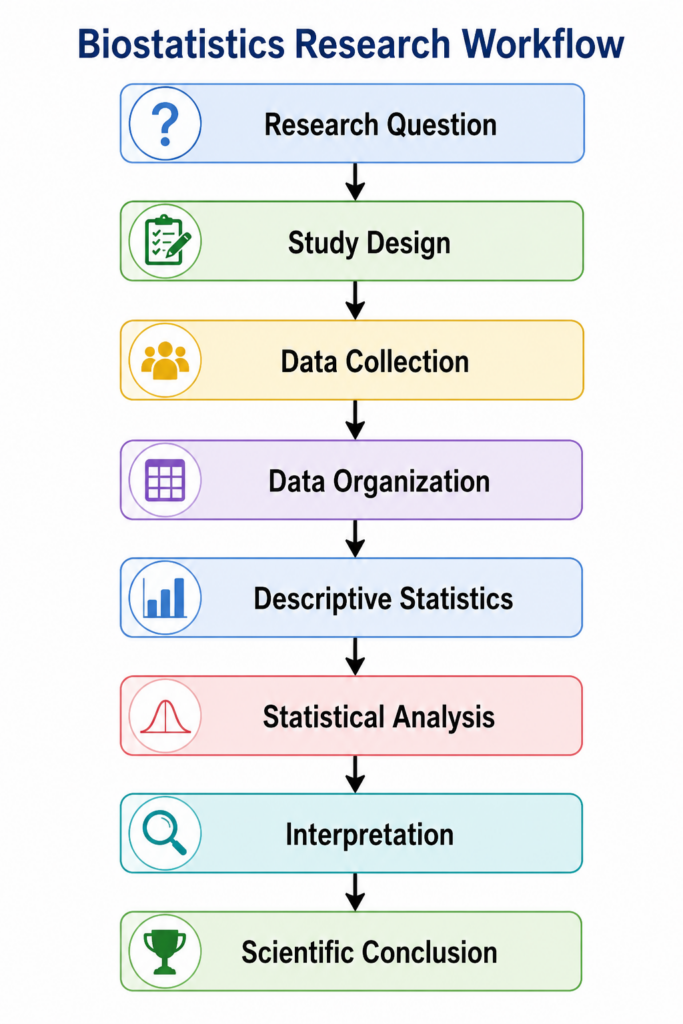
Biostatistics is the branch of statistics that applies statistical methods to biological, medical, agricultural, pharmaceutical, and public health research.
It involves:
- Collecting data
- Organizing data
- Summarizing data
- Analyzing data
- Interpreting results
- Drawing scientific conclusions
Example
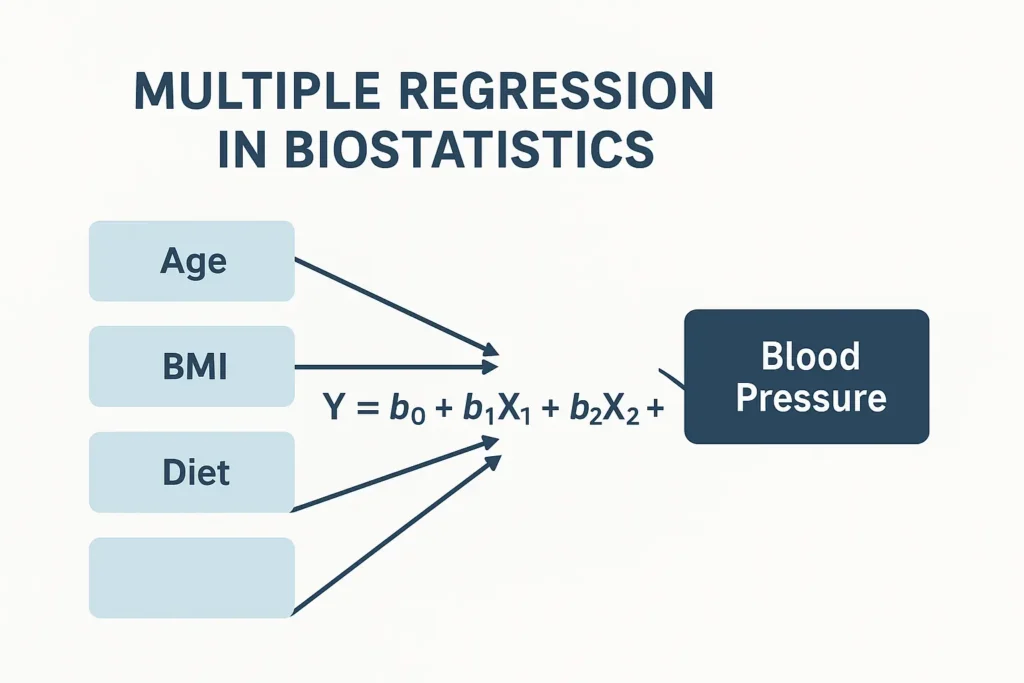
A researcher wants to determine whether a new drug lowers blood pressure more effectively than an existing drug.
Biostatistics helps:
- Design the study
- Collect patient data
- Analyze treatment effects
- Determine statistical significance
- Draw valid conclusions
1. Population and Sample
Population
A population is the complete group of individuals or observations of interest.
Example
All diabetic patients in India.
Sample
A sample is a subset selected from the population.
Example
500 diabetic patients selected from hospitals across India.
Why Important?
Studying an entire population is often expensive and time-consuming. Therefore, researchers analyze samples and make conclusions about the population.
2. Variables
A variable is any characteristic that can take different values.
Types of Variables
Qualitative Variables
Describe categories or qualities.
Examples:
- Gender
- Blood Group
- Disease Status
Quantitative Variables
Represent numerical values.
Examples:
- Age
- Weight
- Height
- Blood Pressure
Table 1: Types of Variables
| Variable | Type |
|---|---|
| Gender | Qualitative |
| Blood Group | Qualitative |
| Age | Quantitative |
| Weight | Quantitative |
| Blood Pressure | Quantitative |
3. Data Types
Understanding data types helps researchers choose the correct statistical test.
Nominal Data
Categories without order.
Examples:
- Gender
- Blood Group
Ordinal Data
Categories with order.
Examples:
- Disease Severity
- Satisfaction Levels
Interval Data
Numerical values with equal intervals but no true zero.
Example:
- Temperature (°C)
Ratio Data
Numerical values with a true zero.
Examples:
- Weight
- Height
- Age
4. Measures of Central Tendency
These statistics describe the center of a dataset.
Mean
Average value.
Formula
Mean = Sum of Values / Number of Observations
Example
Data: 10, 15, 20
Mean = (10 + 15 + 20)/3 = 15
Median
Middle value after arranging data.
Example:
5, 10, 15, 20, 25
Median = 15
Mode
Most frequently occurring value.
Example:
2, 3, 3, 5, 7
Mode = 3
Table 2: Central Tendency Measures
| Measure | Meaning |
|---|---|
| Mean | Average |
| Median | Middle Value |
| Mode | Most Frequent Value |
5. Measures of Dispersion
Dispersion describes variability within data.
Range
Difference between highest and lowest values.
Range = Maximum − Minimum
Variance
Measures spread around the mean.
Higher variance indicates greater variability.
Standard Deviation (SD)
Most commonly used measure of variability.
Interpretation
Small SD:
- Data clustered around mean
Large SD:
- Data widely spread
Example
Mean Blood Pressure = 120 mmHg
SD = 5 mmHg
Most observations fall close to 120 mmHg.
6. Normal Distribution
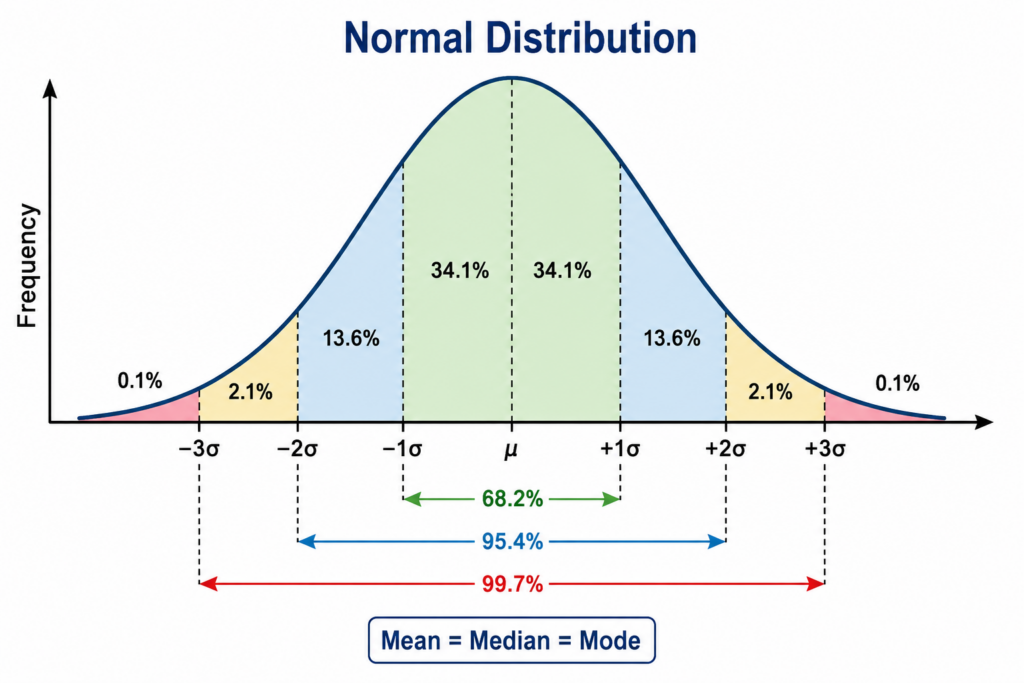
A normal distribution is a symmetrical bell-shaped distribution.
Characteristics:
- Mean = Median = Mode
- Symmetrical shape
- Common in biological data
Examples:
- Human height
- Body weight
- Blood pressure
7. Hypothesis Testing
Hypothesis testing helps determine whether observed differences are statistically significant.
Null Hypothesis (H₀)
Assumes no difference exists.
Example:
The new drug has no effect on blood pressure.
Alternative Hypothesis (H₁)
Assumes a difference exists.
Example:
The new drug reduces blood pressure.
8. P-Value
The p-value indicates the probability of obtaining observed results by chance.
Common Rule
- p < 0.05 → Significant
- p ≥ 0.05 → Not Significant
Example
p = 0.03
Interpretation:
There is sufficient evidence to reject the null hypothesis.
Table 3: P-Value Interpretation
| P-value | Interpretation |
|---|---|
| < 0.05 | Significant |
| < 0.01 | Highly Significant |
| ≥ 0.05 | Not Significant |
9. Confidence Interval (CI)
A confidence interval provides a range within which the true population value is expected to lie.
Example
Mean Blood Pressure = 120 mmHg
95% CI = 115–125 mmHg
Interpretation:
Researchers are 95% confident that the true population mean lies between 115 and 125 mmHg.
10. Correlation
Correlation measures the strength and direction of the relationship between two variables.
Positive Correlation
Both variables increase together.
Example:
Height and Weight
Negative Correlation
One variable increases while the other decreases.
Example:
Exercise Time and Body Fat Percentage
No Correlation
No relationship exists.
Table 4: Correlation Interpretation
| Correlation Coefficient (r) | Interpretation |
|---|---|
| +1.0 | Perfect Positive |
| +0.7 to +0.9 | Strong Positive |
| 0 | No Correlation |
| -0.7 to -0.9 | Strong Negative |
| -1.0 | Perfect Negative |
11. Statistical Significance vs Practical Significance
Many students confuse these concepts.
Statistical Significance
Indicates whether results are unlikely due to chance.
Measured using:
- p-values
- confidence intervals
Practical Significance
Indicates whether findings are meaningful in real-world situations.
Example
A drug reduces blood pressure by 1 mmHg.
- Statistically significant? Yes
- Clinically meaningful? Possibly No
12. Type I and Type II Errors
These errors occur during hypothesis testing.
Type I Error (False Positive)
Rejecting a true null hypothesis.
Example:
Concluding a drug works when it actually does not.
Type II Error (False Negative)
Failing to reject a false null hypothesis.
Example:
Concluding a drug does not work when it actually works.
Table 5: Errors in Hypothesis Testing
| Reality | Decision | Error Type |
|---|---|---|
| Drug ineffective | Reject H₀ | Type I |
| Drug effective | Accept H₀ | Type II |
13. Sample Size
Sample size affects study reliability.
Small Sample Size
- Lower power
- Less reliable results
Large Sample Size
- Higher accuracy
- Better representation
Example
Studying 10 patients may not represent an entire population, whereas studying 1000 patients provides more reliable conclusions.
14. Descriptive vs Inferential Statistics
Descriptive Statistics
Summarize data.
Examples:
- Mean
- Median
- Standard Deviation
- Frequency Tables
Inferential Statistics
Make conclusions about populations based on sample data.
Examples:
- t-test
- ANOVA
- Chi-square test
- Regression Analysis
Table 6: Descriptive vs Inferential Statistics
| Descriptive Statistics | Inferential Statistics |
|---|---|
| Summarizes Data | Makes Predictions |
| Mean | t-test |
| Median | ANOVA |
| Standard Deviation | Regression |
Real-Life Example
A researcher investigates whether a new fertilizer increases plant height.
Step 1
Select:
- Control Group
- Treatment Group
Step 2
Collect plant height measurements.
Step 3
Calculate:
- Mean
- Standard Deviation
Step 4
Perform a t-test.
Step 5
Interpret p-value.
Step 6
Draw conclusions.
This simple study uses many of the biostatistical concepts discussed in this article.
Conclusion
Biostatistics is much more than running statistical software. A strong understanding of fundamental concepts such as population, sample, variables, data types, measures of central tendency, dispersion, normal distribution, hypothesis testing, p-values, confidence intervals, correlation, and statistical errors forms the foundation of scientific research.
Before learning advanced techniques like regression, survival analysis, machine learning, or multivariate statistics, students should master these essential biostatistics concepts. These principles help ensure accurate data analysis, reliable interpretations, and scientifically sound conclusions.
Whether you are a student, researcher, healthcare professional, or scientist, understanding these concepts will significantly improve your ability to analyze and interpret biological data effectively.