Introduction
When two laboratory analyzers, diagnostic instruments, clinical methods, or measurement techniques are used to measure the same biological variable, researchers need to determine whether the methods produce sufficiently similar results. A high correlation alone is not enough to demonstrate agreement between two methods.
The Concordance Correlation Coefficient (CCC) is a useful statistical measure for evaluating the agreement between two continuous measurement methods. It assesses how closely paired observations fall around the ideal 45° line through the origin, where the two methods would give identical values.
In this tutorial, the CCC procedure in MedCalc Statistical Software is demonstrated using an educationally generated biomedical dataset comparing Reference Analyzer HbA1c (%) with New Analyzer HbA1c (%).
The article explains the concept of CCC, MedCalc’s Variable Y, Variable X, Filter, logarithmic transformation options, interpretation of the numerical result, and interpretation of the concordance plot.
What is Concordance Correlation Coefficient?
The Concordance Correlation Coefficient (CCC) is a statistic developed by Lawrence I-Kuei Lin to evaluate the reproducibility and agreement between two measurement methods. Lin’s original work was published in Biometrics in 1989.
CCC is particularly useful when researchers want to know whether two methods provide similar numerical measurements, rather than merely determining whether the two variables are correlated.
For example, suppose a laboratory uses an established HbA1c analyzer and introduces a new analyzer. Both analyzers measure the same blood samples. A researcher may want to know:
Does the new analyzer produce measurements that agree closely with the reference analyzer?
CCC is designed to address this type of question.
Concept of Concordance Correlation Coefficient
The CCC combines two important components:
- Precision
- Accuracy
MedCalc describes the CCC as:
where ρ represents the Pearson correlation coefficient and Cb is a bias-correction factor.
Precision
Precision describes how closely the observations follow their best-fit relationship.
If the measurements have a strong linear relationship, the Pearson correlation component will be close to 1.
Accuracy
Accuracy in the CCC framework refers to how closely the fitted relationship agrees with the ideal 45° line through the origin.
Therefore, a method can have a high correlation but still have lower concordance if systematic differences exist between the two methods.
This is one of the main reasons CCC is useful for method-comparison studies.
Biomedical Example: HbA1c Method Comparison
For this Episode 64 tutorial, an HbA1c laboratory method-comparison dataset is used.
The dataset contains:
- 20 samples
- Reference Analyzer HbA1c measurements
- New Analyzer HbA1c measurements
- HbA1c expressed as %
Educationally generated dataset
| Sample ID | Reference Analyzer HbA1c (%) | New Analyzer HbA1c (%) |
|---|---|---|
| 1 | 5.1 | 5.2 |
| 2 | 5.4 | 5.3 |
| 3 | 5.7 | 5.8 |
| 4 | 6.0 | 6.1 |
| 5 | 6.2 | 6.3 |
| 6 | 6.5 | 6.4 |
| 7 | 6.8 | 6.9 |
| 8 | 7.0 | 7.1 |
| 9 | 7.3 | 7.2 |
| 10 | 7.5 | 7.6 |
| 11 | 7.8 | 7.9 |
| 12 | 8.0 | 7.9 |
| 13 | 8.3 | 8.4 |
| 14 | 8.6 | 8.5 |
| 15 | 8.9 | 9.0 |
| 16 | 9.1 | 9.2 |
| 17 | 9.4 | 9.3 |
| 18 | 9.7 | 9.8 |
| 19 | 10.0 | 10.1 |
| 20 | 10.3 | 10.2 |
Note: This is an educationally generated dataset created for statistical demonstration. It is not real patient data.
📥 Download the Concordance Correlation Coefficient (CCC) Practice Dataset – Excel
Why Use CCC Instead of Pearson Correlation?
Pearson correlation measures the degree to which two variables change together linearly. However, a high Pearson correlation does not necessarily mean that two methods produce the same numerical values.
Consider two methods where one method consistently produces measurements slightly higher than the other. Their Pearson correlation could still be extremely high because their values follow the same pattern.
CCC goes further by incorporating a bias-correction component that considers departure from the ideal line of equality.
Therefore:
Pearson correlation → association
CCC → concordance/agreement
For method-comparison research, this distinction is important.
How to Perform CCC in MedCalc
Open MedCalc and select:
Statistics → Concordance correlation coefficient
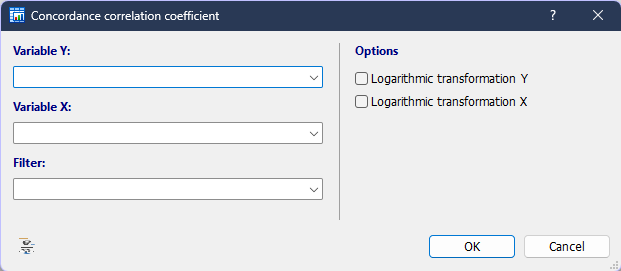
The MedCalc CCC procedure requires two variables representing the two measurement techniques being compared.
The dialog contains four main input areas:
- Variable Y
- Variable X
- Filter
- Logarithmic transformation options
1. Variable Y
The Variable Y field is used to select one of the two measurement variables.
For our example:
Variable Y = New Analyzer HbA1c (%)
This represents the new measurement method.
The choice of which method is assigned to X or Y should be documented clearly in the analysis because it makes the method comparison easier to understand.
Recommended setting
Variable Y → New Analyzer HbA1c (%)
2. Variable X
The Variable X field is used for the second measurement method.
For our example:
Variable X = Reference Analyzer HbA1c (%)
The reference method is therefore placed on the X-axis of the concordance plot.
Recommended setting
Variable X → Reference Analyzer HbA1c (%)
MedCalc’s CCC procedure requires the two techniques being compared to be selected as the X and Y variables.
3. Filter
The Filter option allows you to include only selected observations in the analysis.
For example, a larger biomedical dataset might contain:
- Male and female participants
- Different age groups
- Diabetic and non-diabetic groups
- Different hospitals
- Different treatment groups
A filter could then be used to analyze only a specific subgroup.
For this example:
Filter = None
Therefore, all 20 HbA1c samples are included.
MedCalc supports filters to restrict statistical analyses to selected cases or subgroups.
4. Logarithmic Transformation Y
The first checkbox in the dialog is:
Logarithmic transformation Y
When selected, MedCalc applies a logarithmic transformation to the Y variable before performing the analysis.
For our dataset:
Y = New Analyzer HbA1c (%)
Should we select it?
No.
For this basic HbA1c example, the analysis is performed on the original measurement scale.
A logarithmic transformation can be useful when the data have a distribution or variance structure for which a log scale is appropriate. MedCalc explains that logarithmic transformation can sometimes improve the suitability of data for statistical analysis, particularly for positively skewed or log-normal variables.
A log transformation should therefore not be selected automatically.
5. Logarithmic Transformation X
The second checkbox is:
Logarithmic transformation X
When selected, MedCalc applies a logarithmic transformation to the X variable.
For our example:
X = Reference Analyzer HbA1c (%)
Setting for this example:
Not selected
Therefore, the reference analyzer values remain on the original HbA1c scale.
MedCalc performs logarithmic transformation using base-10 logarithms, and logarithms cannot be directly applied to zero or negative values.
CCC Result
Using the educational dataset above, the approximate calculated values are:
| Statistic | Result |
|---|---|
| Sample size | 20 |
| Pearson correlation | 0.9981 |
| Bias-correction component | ≈ 0.9998 |
| Concordance correlation coefficient | 0.9979 |
The CCC calculation from these values is approximately 0.9979.
Result Interpretation
The CCC is approximately:
CCC = 0.9979
This value is very close to 1, indicating very strong concordance between the Reference Analyzer and New Analyzer measurements in this educational dataset.
MedCalc presents a descriptive scale based on McBride (2005):
| CCC | Strength of agreement |
|---|---|
| < 0.90 | Poor |
| 0.90–0.95 | Moderate |
| 0.95–0.99 | Substantial |
| > 0.99 | Almost perfect |
Because the calculated value is approximately 0.9979, it falls within the 0.95–0.99 category under this scale and can be described as substantial agreement.
However, these categories are descriptive guidelines rather than universal clinical acceptance criteria. The practical acceptability of a new method should also depend on the measurement’s clinical context and predefined analytical requirements.
Scatter Plot Interpretation
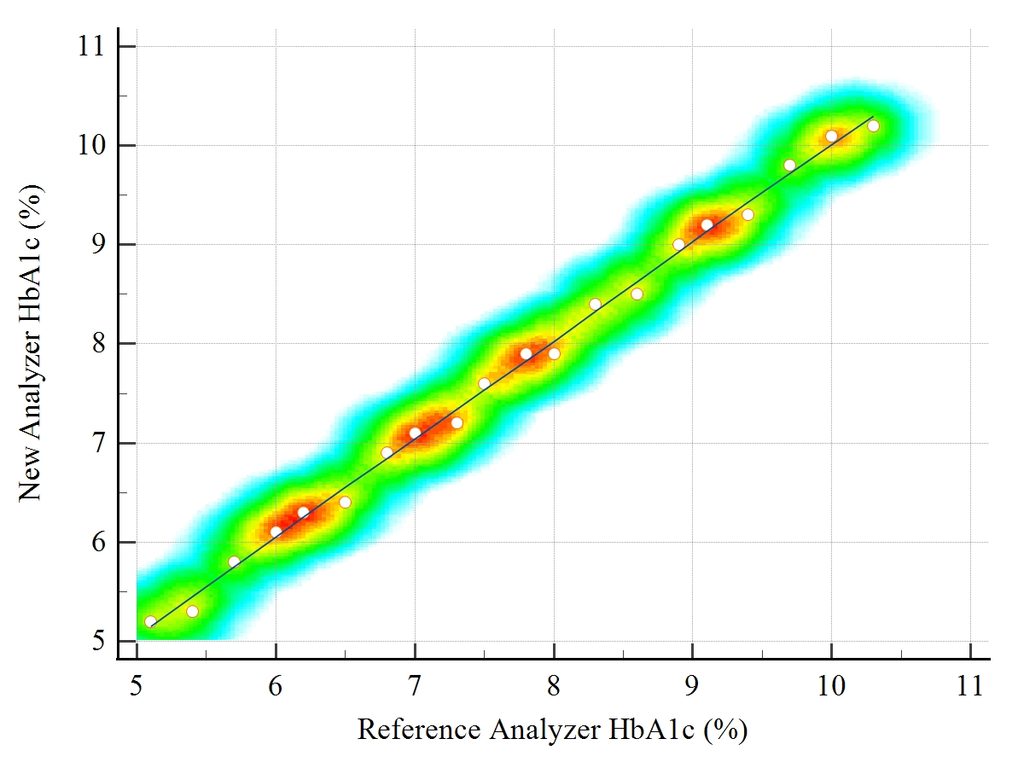
The scatter/concordance plot is an important visual component of the analysis.
In the supplied plot:
- X-axis: Reference Analyzer HbA1c (%)
- Y-axis: New Analyzer HbA1c (%)
- Each point represents one paired measurement.
- The observations follow a very strong upward linear pattern.
- The points are positioned close to the concordance/equality line.
The ideal line is the:
45° line through the origin
This represents:
New Analyzer = Reference Analyzer
If both methods give exactly the same result for a sample, its point would lie on this line. MedCalc defines CCC in terms of how closely paired observations fall around this 45° line through the origin.
Interpretation of scatter plot
The points in the supplied HbA1c plot are tightly clustered around the diagonal line. This indicates that the two measurement methods produce very similar values across the observed HbA1c range.
The plot therefore visually supports the high CCC obtained from the numerical analysis.
However, the plot should be interpreted together with the CCC rather than used as a replacement for the numerical statistic.
What Does a Point Away from the Line Mean?
If a point is located above the 45° line:
New Analyzer > Reference Analyzer
If a point is below the line:
New Analyzer < Reference Analyzer
Large deviations from the line indicate greater disagreement for those observations.
If the points form a narrow band around the line, the two methods have strong concordance.
CCC vs Correlation
This is one of the most important concepts in this analysis.
Pearson correlation
Measures the strength of the linear association between two variables.
Concordance correlation coefficient
Evaluates how closely the paired measurements agree with the ideal equality relationship.
Therefore, two methods may have:
High Pearson correlation + lower CCC
if there is systematic bias between the methods.
CCC is consequently more informative than correlation alone when the objective is to evaluate agreement between two continuous measurement methods.
CCC vs Bland–Altman Analysis
CCC and Bland–Altman analysis are both useful in method-comparison studies, but they provide different information.
| Method | Main purpose |
|---|---|
| Pearson correlation | Linear association |
| CCC | Concordance/agreement |
| Bland–Altman | Differences, bias and limits of agreement |
| Passing–Bablok regression | Method-comparison regression |
A high CCC does not by itself establish that two methods are clinically interchangeable for every application. Researchers should consider the measurement scale, clinically acceptable differences, and complementary method-comparison analyses.
How to Report CCC in a Research Article
A suitable reporting format is:
“Concordance between the reference and new HbA1c analyzers was assessed using Lin’s concordance correlation coefficient. The CCC was 0.9979, indicating substantial agreement according to the descriptive criteria used for continuous variables.”
If confidence intervals are available from the final MedCalc output, they should also be reported.
A methods section should clearly state:
- The two measurement methods
- Sample size
- CCC method
- Whether transformations were used
- The CCC estimate
- Confidence interval, when available
- The criteria used for interpretation
Important Points
- CCC is used to assess agreement between two continuous measurement methods.
- CCC is different from Pearson correlation.
- CCC considers both precision and accuracy.
- Variable X and Variable Y should represent the two methods being compared.
- Filter can be used to analyze a specific subgroup.
- Logarithmic transformations should only be used when scientifically appropriate.
- CCC values closer to 1 indicate stronger concordance.
- The 45° line through the origin represents perfect concordance.
- The scatter plot provides useful visual information about agreement.
- CCC should be interpreted in combination with the clinical or analytical requirements of the study.
Conclusion
The Concordance Correlation Coefficient (CCC) is a useful statistical method for evaluating agreement between two continuous measurement techniques.
In this MedCalc tutorial, an educationally generated HbA1c dataset was used to compare a Reference Analyzer with a New Analyzer. The recommended settings were New Analyzer HbA1c as Variable Y, Reference Analyzer HbA1c as Variable X, no filter, and no logarithmic transformation.
The calculated CCC for the example dataset was approximately 0.9979, demonstrating very strong concordance between the two methods. The corresponding scatter plot also showed the observations closely following the 45° equality line.
The important distinction is that correlation measures association, whereas CCC evaluates concordance. For biomedical method-comparison studies, this distinction is essential.
CCC can provide a useful summary of agreement, but it should not be interpreted in isolation. Depending on the research question, it may be appropriate to complement CCC with methods such as Bland–Altman analysis or regression-based method comparison.