Introduction
Polynomial Regression is an advanced statistical technique used in Biostatistics to model nonlinear relationships between variables. In many biological and medical studies, the association between an independent variable and a dependent variable is not always linear. For example, the growth rate of plants, drug dosage effects, enzyme activity, and disease progression often exhibit curved patterns rather than straight-line relationships.
Traditional linear regression assumes that the relationship between variables is linear. However, when data points show curvature, Polynomial Regression provides a better fit by incorporating higher-order terms such as squared or cubed values of the predictor variable.
Biostatisticians use Polynomial Regression to understand complex biological phenomena, improve prediction accuracy, and identify optimal values in experimental studies. This article explains the concept, mathematical model, assumptions, interpretation, applications, and examples of Polynomial Regression in Biostatistics.
What is Polynomial Regression?
Polynomial Regression is a form of regression analysis in which the relationship between the independent variable (X) and dependent variable (Y) is modeled as an nth-degree polynomial.
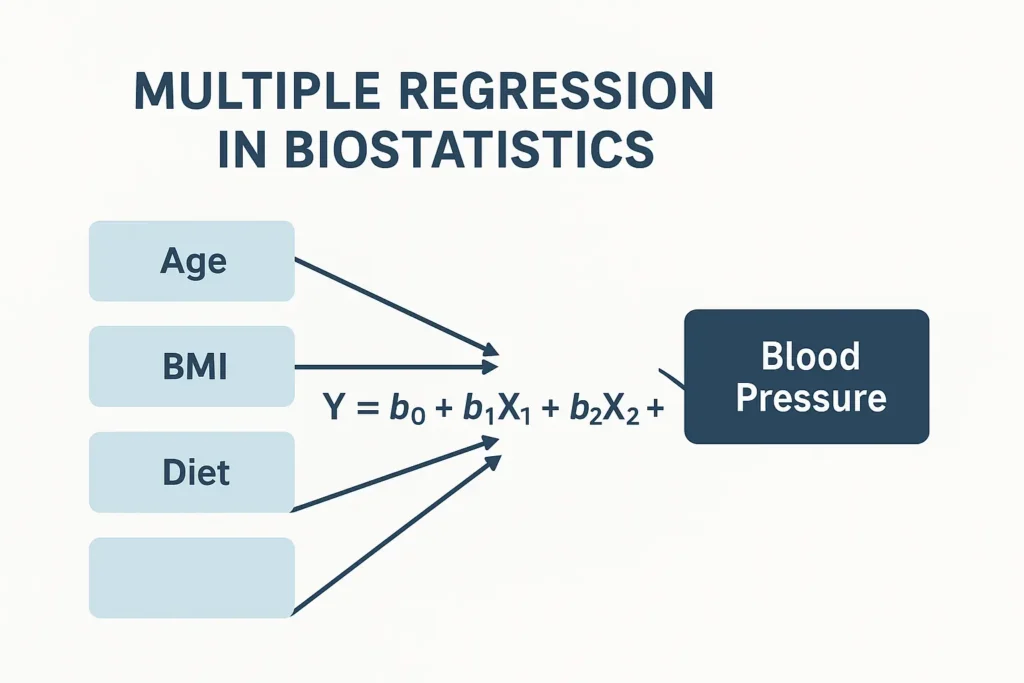
Although it is called polynomial regression, it is actually a special case of multiple linear regression because the coefficients remain linear.
General Polynomial Regression Equation
For a second-degree polynomial (Quadratic Model):
For a third-degree polynomial (Cubic Model):
Where:
| Symbol | Meaning |
|---|---|
| Y | Dependent Variable |
| X | Independent Variable |
| β₀ | Intercept |
| β₁ | Linear Coefficient |
| β₂ | Quadratic Coefficient |
| β₃ | Cubic Coefficient |
| ε | Random Error |
The inclusion of higher-order terms allows the model to capture curved relationships in biological data.
Why Polynomial Regression is Important in Biostatistics
Many biological systems demonstrate nonlinear behavior.
Examples include:
- Growth of bacteria over time
- Drug concentration and therapeutic response
- Body weight and age relationships
- Hormone secretion patterns
- Population growth studies
- Enzyme reaction kinetics
Using simple linear regression in such situations may produce misleading conclusions.
Polynomial Regression helps:
✔ Capture nonlinear trends
✔ Improve prediction accuracy
✔ Understand biological mechanisms
✔ Identify turning points
✔ Optimize treatment conditions
Concept of Polynomial Regression
Consider a study evaluating the relationship between fertilizer concentration and plant height.
Linear Relationship
A straight-line model assumes:
However, plants may initially grow rapidly with increasing fertilizer, then growth slows due to nutrient saturation.
The relationship becomes curved.
Polynomial Relationship
A quadratic model can represent this curvature:
The squared term captures the bend in the curve.
This enables a more realistic representation of biological processes.
Types of Polynomial Regression
1. Quadratic Regression
Contains the squared term.
Used when data forms a U-shaped or inverted U-shaped pattern.
Applications
- Drug dosage studies
- Plant growth analysis
- Disease progression
2. Cubic Regression
Contains a cubic term.
Captures more complex biological patterns.
Applications
- Hormonal fluctuations
- Population dynamics
- Environmental studies
3. Higher-Order Polynomial Regression
Includes fourth-degree and higher terms.
Useful for highly nonlinear data but may cause overfitting.
Assumptions of Polynomial Regression
Before applying Polynomial Regression, several assumptions should be checked.
1. Independence of Observations
Each observation must be independent.
2. Homoscedasticity
Residuals should have constant variance.
3. Normal Distribution of Residuals
Residuals should approximately follow a normal distribution.
4. Correct Model Specification
The selected polynomial degree should adequately represent the relationship.
5. Absence of Extreme Outliers
Outliers can significantly affect the fitted curve.
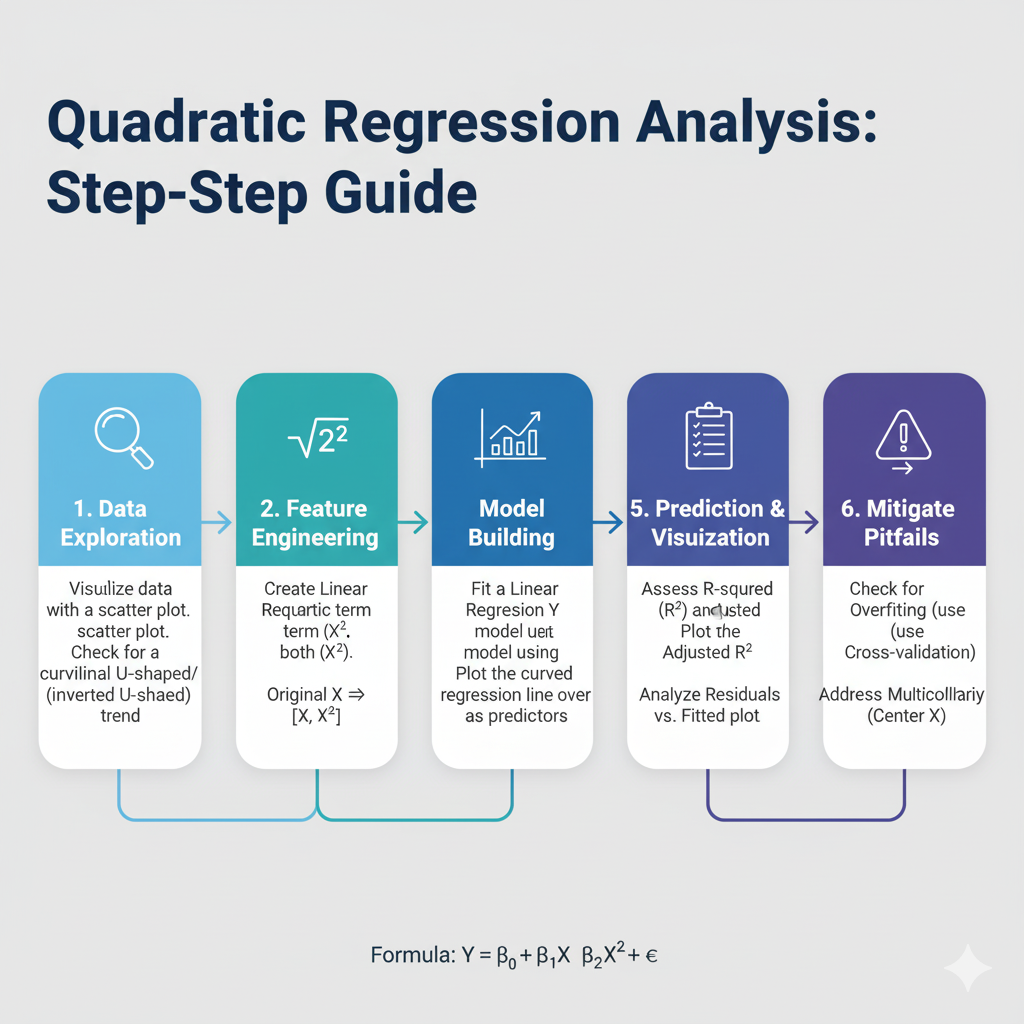
Step-by-Step Procedure for Polynomial Regression
Step 1: Define Research Question
Example:
How does fertilizer concentration affect plant height?
Step 2: Collect Data
Measure:
- Fertilizer concentration (X)
- Plant height (Y)
Step 3: Explore Data
Create a scatter plot.
Look for:
- Linear pattern
- Curved pattern
- Outliers
Step 4: Choose Polynomial Degree
Common choices:
- Degree 2 (Quadratic)
- Degree 3 (Cubic)
Step 5: Fit the Model
Estimate regression coefficients using statistical software such as:
- R
- SPSS
- SAS
- MedCalc
- Python
Step 6: Evaluate Model Fit
Examine:
- R²
- Adjusted R²
- Residual plots
- p-values
Step 7: Interpret Results
Determine:
- Significance of polynomial terms
- Direction of relationship
- Turning points
Example of Polynomial Regression in Biostatistics
A researcher investigates the effect of fertilizer concentration on plant height.
Dataset
| Fertilizer (g/L) | Plant Height (cm) |
|---|---|
| 1 | 10 |
| 2 | 15 |
| 3 | 22 |
| 4 | 30 |
| 5 | 35 |
| 6 | 37 |
| 7 | 36 |
| 8 | 34 |
The data indicate rapid growth initially and then a decline, suggesting a nonlinear relationship.
Quadratic Polynomial Model
The fitted model is:
Where:
- Intercept = 3
- Linear coefficient = 9.2
- Quadratic coefficient = -0.68
The negative quadratic coefficient indicates an inverted U-shaped relationship.
Predicted Values Table
| Fertilizer (g/L) | Observed Height | Predicted Height |
|---|---|---|
| 1 | 10 | 11.5 |
| 2 | 15 | 18.6 |
| 3 | 22 | 24.3 |
| 4 | 30 | 28.6 |
| 5 | 35 | 31.6 |
| 6 | 37 | 33.2 |
| 7 | 36 | 33.5 |
| 8 | 34 | 32.4 |
The predicted values closely match observed values, indicating a good model fit.
Figure: Polynomial Regression Curve
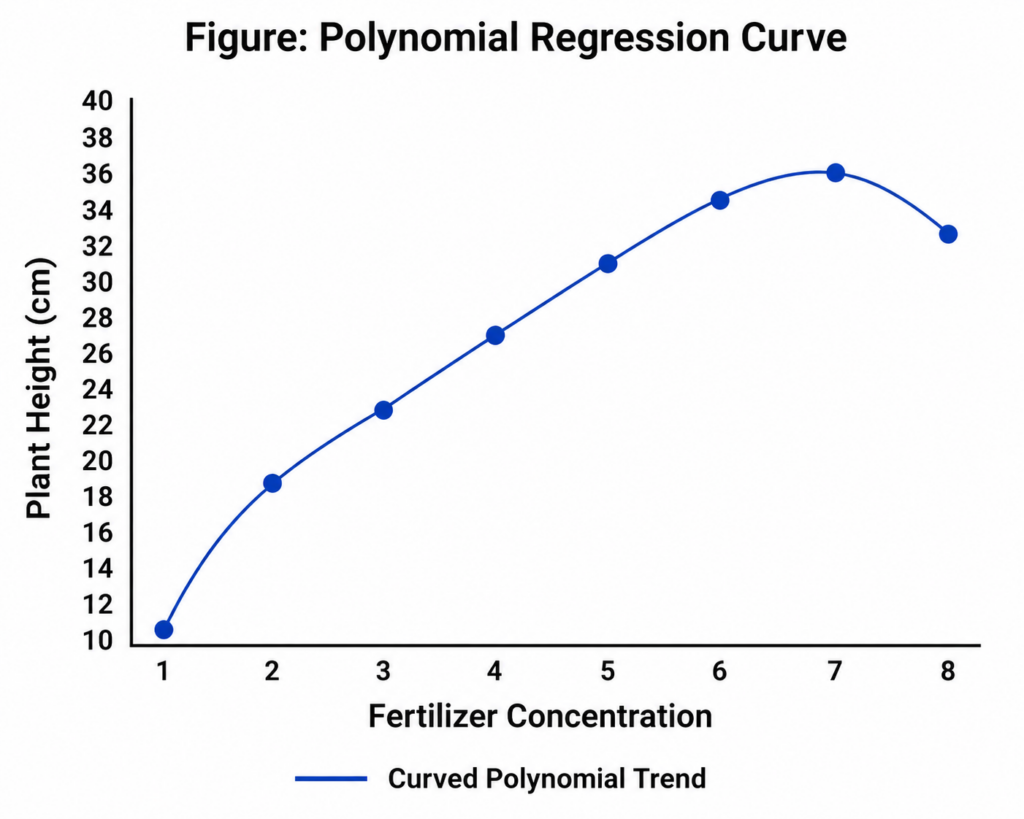
The graph shows a nonlinear relationship where plant height increases and then decreases after reaching an optimum fertilizer level.
Interpretation of Polynomial Regression Results
Suppose statistical software provides:
| Parameter | Estimate | p-value |
|---|---|---|
| Intercept | 3.0 | 0.010 |
| X | 9.2 | <0.001 |
| X² | -0.68 | 0.002 |
Interpretation
- The intercept is statistically significant.
- Fertilizer concentration significantly affects plant height.
- The squared term is significant, confirming a nonlinear relationship.
- Plant growth increases initially and then declines.
Advantages of Polynomial Regression
Captures Nonlinear Relationships
Provides a realistic representation of biological systems.
Improved Predictive Accuracy
Often fits biological data better than linear regression.
Easy Implementation
Available in most statistical software.
Flexible Modeling
Can model complex patterns using higher-order terms.
Limitations of Polynomial Regression
Overfitting Risk
High-degree polynomials may fit noise rather than actual trends.
Difficult Interpretation
Higher-order coefficients may be challenging to interpret biologically.
Poor Extrapolation
Predictions outside the observed range may be unreliable.
Sensitive to Outliers
Extreme observations can distort the fitted curve.
Applications of Polynomial Regression in Biostatistics
Medical Research
- Drug-response studies
- Treatment optimization
- Disease progression analysis
Agriculture
- Fertilizer response experiments
- Crop yield prediction
- Growth studies
Environmental Biology
- Pollution impact assessment
- Species population studies
Pharmacology
- Dose-response modeling
- Toxicity assessment
Epidemiology
- Disease trend analysis
- Risk factor modeling
Comparison Between Linear and Polynomial Regression
| Feature | Linear Regression | Polynomial Regression |
|---|---|---|
| Relationship | Straight Line | Curved Line |
| Complexity | Simple | Moderate |
| Accuracy for Nonlinear Data | Low | High |
| Biological Applications | Limited | Extensive |
| Prediction Ability | Moderate | Better for Curved Data |
Conclusion
Polynomial Regression is a powerful statistical technique in Biostatistics for modeling nonlinear relationships between variables. Unlike simple linear regression, it incorporates higher-order terms to capture biological patterns that follow curved trends. It is widely used in medical research, agriculture, pharmacology, epidemiology, and environmental studies. By accurately representing complex biological processes, Polynomial Regression improves prediction, interpretation, and decision-making. Researchers should carefully choose the polynomial degree to balance model accuracy and avoid overfitting. When applied appropriately, Polynomial Regression serves as an essential tool for advanced biological data analysis and scientific research.