
Introduction
Two-Way Analysis of Covariance (ANCOVA) is an extension of Analysis of Variance (ANOVA) that allows researchers to examine the effects of two categorical independent variables on a continuous dependent variable while statistically controlling for the influence of a continuous covariate.
In biomedical, biological, pharmaceutical, agricultural and social science research, the outcome variable may be influenced by several factors simultaneously. If the researcher wants to determine whether two experimental factors affect an outcome while controlling for an initial measurement, Two-Way ANCOVA is an appropriate analytical technique.
In this example, Final Sugar Level is the dependent variable, while Drugs and Diet are the two categorical factors. Initial Sugar Level is included as the covariate. The SPSS analysis contains 40 observations, with four drug groups and two diet conditions.
The primary objectives are to determine:
- Whether the different drugs significantly affect Final Sugar Level.
- Whether Diet significantly affects Final Sugar Level.
- Whether there is a significant Drug × Diet interaction.
- Whether Initial Sugar Level significantly explains variation in Final Sugar Level after adjustment for the experimental factors.
- Which drug groups differ significantly from one another using Bonferroni-adjusted comparisons.
What is Two-Way ANCOVA?
Two-Way ANCOVA is a statistical method used when a researcher has:
- One continuous dependent variable.
- Two categorical independent variables (factors).
- At least one continuous covariate that needs to be statistically controlled.
The general model can be represented as:
Dependent Variable = Covariate + Factor A + Factor B + Factor A × Factor B + Error
For the present analysis:
- Dependent variable: Final Sugar Level
- Factor A: Drugs
- Factor B: Diet
- Covariate: Initial Sugar Level
- Interaction: Drugs × Diet
The SPSS syntax confirms that FinalSugarLevel was analyzed by Drugs and Dite while controlling for InitialSugarLevel. The model also included the Drugs × Dite interaction.
Variables Used in the Analysis
The dataset contains four drug groups:
| Drug group | n |
|---|---|
| Control | 10 |
| Drug A | 10 |
| Drug B | 10 |
| Drug C | 10 |
| Total | 40 |
There are also two diet conditions:
| Diet condition | n |
|---|---|
| Diet | 20 |
| Non Diet | 20 |
| Total | 40 |
The design therefore represents a 4 × 2 factorial structure, with four drug categories and two diet conditions.
Why is the Covariate Important?
Initial Sugar Level may differ among individuals before treatment. If these baseline differences are not considered, they can influence the observed Final Sugar Level.
ANCOVA statistically adjusts the dependent variable for the covariate. In this analysis, the estimated marginal means were calculated at the mean Initial Sugar Level = 287.2500.
Therefore, the comparisons among drugs and diet conditions represent adjusted means, rather than simply relying on the raw observed group means.
Descriptive Statistics
The observed Final Sugar Level means are shown below.
| Drugs | Diet | Mean | SD | n |
|---|---|---|---|---|
| Control | Diet | 226.00 | 16.39 | 5 |
| Control | Non Diet | 276.20 | 19.94 | 5 |
| Drug A | Diet | 153.20 | 4.66 | 5 |
| Drug A | Non Diet | 198.20 | 7.50 | 5 |
| Drug B | Diet | 233.60 | 7.09 | 5 |
| Drug B | Non Diet | 286.60 | 13.76 | 5 |
| Drug C | Diet | 132.60 | 7.54 | 5 |
| Drug C | Non Diet | 160.60 | 7.83 | 5 |
The descriptive statistics show considerable differences among drug groups. Drug C has the lowest observed Final Sugar Level under both diet conditions, whereas Drug B has relatively high values. The Non Diet condition also has higher mean Final Sugar Levels than the Diet condition across all four drug groups.
Assumption: Homogeneity of Variance
Before interpreting ANCOVA results, an important assumption is the equality of error variances across groups.
The Levene’s Test results are:
| Test | F | df1 | df2 | p-value |
|---|---|---|---|---|
| Levene’s test | 2.013 | 7 | 32 | 0.084 |
Since p = 0.084 > 0.05, the result is not statistically significant. Therefore, there is no evidence of unequal error variances, and the homogeneity of variance assumption is considered satisfied for this analysis.
Two-Way ANCOVA Results
The principal ANCOVA results are presented below.
Table: Tests of Between-Subjects Effects
| Source | Type III SS | df | MS | F | p-value | Partial η² |
|---|---|---|---|---|---|---|
| Initial Sugar Level | 333.634 | 1 | 333.634 | 2.539 | 0.121 | 0.076 |
| Drugs | 89,431.673 | 3 | 29,810.558 | 226.860 | <0.001 | 0.956 |
| Diet | 14,319.107 | 1 | 14,319.107 | 108.969 | <0.001 | 0.779 |
| Drugs × Diet | 837.018 | 3 | 279.006 | 2.123 | 0.117 | 0.170 |
| Error | 4,073.566 | 31 | 131.405 | — | — | — |
The complete SPSS output reports a significant corrected model, F(8,31) = 108.943, p < 0.001, with R² = 0.966 and adjusted R² = 0.957.
Effect of Initial Sugar Level
The covariate, Initial Sugar Level, was not statistically significant, with:
F(1,31) = 2.539, p = 0.121, partial η² = 0.076.
Because p > 0.05, the analysis does not provide sufficient evidence that Initial Sugar Level had a significant linear effect on Final Sugar Level after accounting for Drugs, Diet and their interaction.
Effect of Drugs
The main effect of Drugs was statistically significant:
F(3,31) = 226.860, p < 0.001, partial η² = 0.956.
This indicates that Final Sugar Level differs significantly among the four drug groups after adjusting for Initial Sugar Level.
The very large partial eta squared value (0.956) indicates a substantial effect of Drugs in this dataset. The estimated marginal means provide a clearer picture of the differences.
Adjusted Estimated Marginal Means for Drugs
| Drug | Adjusted Mean | SE | 95% CI |
|---|---|---|---|
| Control | 251.454 | 3.632 | 244.047–258.861 |
| Drug A | 176.726 | 3.682 | 169.217–184.235 |
| Drug B | 258.643 | 3.739 | 251.018–266.268 |
| Drug C | 146.678 | 3.625 | 139.284–154.071 |
The adjusted means suggest that Drug C produced the lowest adjusted Final Sugar Level, followed by Drug A. Control and Drug B had substantially higher adjusted means.
Bonferroni Pairwise Comparisons
Bonferroni-adjusted comparisons were performed to identify which drug groups differed significantly.
| Comparison | Mean Difference | p-value | Interpretation |
|---|---|---|---|
| Control vs Drug A | 74.727 | <0.001 | Significant |
| Control vs Drug B | -7.189 | 1.000 | Not significant |
| Control vs Drug C | 104.776 | <0.001 | Significant |
| Drug A vs Drug B | -81.916 | <0.001 | Significant |
| Drug A vs Drug C | 30.049 | <0.001 | Significant |
| Drug B vs Drug C | 111.965 | <0.001 | Significant |
Thus, all drug comparisons were statistically significant except Control versus Drug B.
This indicates that Drug A and Drug C differ substantially from the other treatment groups, whereas Control and Drug B have statistically comparable adjusted Final Sugar Levels.
Effect of Diet
Diet also had a statistically significant main effect:
F(1,31) = 108.969, p < 0.001, partial η² = 0.779.
Therefore, after adjusting for Initial Sugar Level and accounting for the drug factor, Final Sugar Level differed significantly between Diet and Non Diet conditions.
Adjusted Means for Diet
| Diet condition | Adjusted Mean | SE | 95% CI |
|---|---|---|---|
| Diet | 187.644 | 2.689 | 182.160–193.127 |
| Non Diet | 229.106 | 2.689 | 223.623–234.590 |
The adjusted mean Final Sugar Level was considerably lower in the Diet group than in the Non Diet group. The Bonferroni-adjusted comparison showed a mean difference of 41.463, with p < 0.001, confirming a statistically significant difference.
Drugs × Diet Interaction
The interaction between Drugs and Diet was:
F(3,31) = 2.123, p = 0.117, partial η² = 0.170.
Since p = 0.117 > 0.05, the Drugs × Diet interaction was not statistically significant.
This means that, based on this ANCOVA model, there is insufficient evidence that the effect of the drug depends significantly on whether participants were in the Diet or Non Diet condition.
Importantly, the non-significant interaction should not be interpreted as proving that the effects are identical. Rather, the analysis did not detect a statistically significant interaction at the 5% significance level.
Figure: Estimated Marginal Means
The SPSS profile plot displays the adjusted means of Final Sugar Level across the four drug groups for Diet and Non Diet conditions.
Estimated marginal means of Final Sugar Level
Adjusted means evaluated at Initial Sugar Level = 287.25, comparing Drugs across Diet and Non Diet conditions.
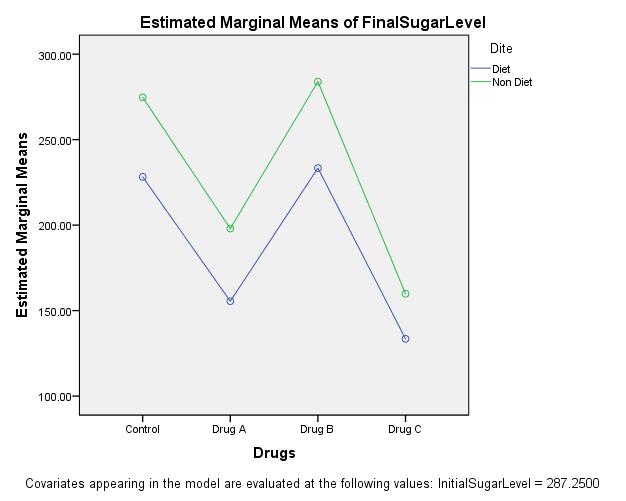
The figure shows that the Diet condition has lower adjusted Final Sugar Level than the Non Diet condition for every drug group. Drug C has the lowest adjusted mean in both conditions, while Drug B has the highest adjusted mean. The lines do not show a statistically significant interaction according to the ANCOVA test.
Figure 1. Estimated marginal means of Final Sugar Level by Drugs and Diet.
Covariates appearing in the model are evaluated at Initial Sugar Level = 287.2500.
Overall Interpretation
The Two-Way ANCOVA demonstrated that the statistical model explained a very large proportion of the variability in Final Sugar Level. The corrected model was significant, F(8,31) = 108.943, p < 0.001, with R² = 0.966.
The main effect of Drugs was significant, indicating substantial differences in adjusted Final Sugar Level among Control, Drug A, Drug B and Drug C.
The main effect of Diet was also significant, showing that participants under the Diet condition had significantly lower adjusted Final Sugar Levels than those in the Non Diet condition.
However, the Drugs × Diet interaction was not statistically significant. Therefore, the available evidence does not support the conclusion that the effect of Drugs changes significantly according to Diet condition.
The covariate Initial Sugar Level was not statistically significant in the final model.
📥 Download Two-Way ANCOVA Dataset
Conclusion
A Two-Way ANCOVA was conducted to examine the effects of Drugs and Diet on Final Sugar Level while controlling for Initial Sugar Level. The homogeneity of variance assumption was satisfied because Levene’s test was not significant, F(7,32) = 2.013, p = 0.084.
The analysis revealed a statistically significant main effect of Drugs, F(3,31) = 226.860, p < 0.001, partial η² = 0.956, and a statistically significant main effect of Diet, F(1,31) = 108.969, p < 0.001, partial η² = 0.779. In contrast, the Drugs × Diet interaction was not significant, F(3,31) = 2.123, p = 0.117, partial η² = 0.170.
The adjusted marginal means showed that Drug C had the lowest Final Sugar Level (146.678), followed by Drug A (176.726), while Control (251.454) and Drug B (258.643) had higher adjusted means. Diet also produced a substantial difference, with an adjusted mean of 187.644 for Diet compared with 229.106 for Non Diet.
Thus, within this dataset, Drug type and Diet were significant predictors of Final Sugar Level after adjustment for Initial Sugar Level, whereas the interaction between Drug and Diet was not statistically significant.



