Introduction
Variance and covariance are two fundamental concepts in biostatistics and statistical data analysis. They are particularly important when researchers work with biological, medical, clinical, epidemiological, and environmental datasets containing multiple quantitative variables.
In biological research, observations rarely have exactly the same values. For example, individuals in a clinical study may differ in height, weight, blood pressure, cholesterol level, blood glucose, or enzyme activity. Variance helps researchers understand how much one variable varies around its mean, while covariance helps determine how two variables vary together.
The combination of variances and covariances is represented using a variance-covariance matrix. This matrix is an important foundation for many multivariate statistical techniques, including multiple regression, principal component analysis (PCA), multivariate analysis, discriminant analysis, and other statistical modeling methods.
Understanding variance-covariance is therefore essential for students, researchers, and professionals working with biological and medical data.
What Is Variance?
Variance is a statistical measure that describes the amount of variability or dispersion present in a dataset.
In simple terms, variance tells us:
How far the observations tend to spread from their mean value.
If observations are very close to the mean, the variance will be relatively small. If observations are widely distributed around the mean, the variance will be larger.
For example, consider two groups of patients with similar average blood pressure:
- Group A: 118, 120, 121, 119, 122
- Group B: 90, 110, 120, 135, 145
Although the average values may be similar, Group B has much greater variability. Therefore, its variance will be higher.
Sample Variance Formula
For a sample, variance is calculated as:
s² = Σ(xᵢ − x̄)² / (n − 1)
Where:
- s² = sample variance
- xᵢ = individual observation
- x̄ = sample mean
- n = number of observations
- n − 1 = degrees of freedom
The deviations from the mean are squared because positive and negative deviations would otherwise cancel each other.
What Is Covariance?
Covariance measures how two quantitative variables change together.
While variance examines one variable, covariance examines the joint variation of two variables.
For example, suppose a researcher records the height and weight of participants. If people with greater height generally tend to have greater weight, height and weight may have a positive covariance.
If one variable tends to increase while the other decreases, their covariance may be negative.
Sample Covariance Formula
The sample covariance between X and Y is:
sₓᵧ = Σ(xᵢ − x̄)(yᵢ − ȳ) / (n − 1)
Where:
- sₓᵧ = sample covariance
- xᵢ = individual observation of X
- yᵢ = individual observation of Y
- x̄ = mean of X
- ȳ = mean of Y
- n = number of paired observations
The sign of covariance indicates the direction in which two variables tend to vary.
Variance and Covariance: Basic Concept
The relationship can be understood as follows:
Variance → variation of one variable
Covariance → joint variation of two variables
For example:
- Blood pressure → variance measures variability in blood pressure.
- Height and weight → covariance measures how height and weight vary together.
- Cholesterol and age → covariance measures how these two variables change together.
This distinction is important because variance is a one-variable measure, whereas covariance is a two-variable measure.
Types of Covariance
Covariance can be broadly interpreted based on its sign.
1. Positive Covariance
Positive covariance occurs when two variables tend to increase or decrease together.
For example, height and body weight may show positive covariance in a particular population.
When height increases and weight also tends to increase, the product of their deviations from their respective means tends to be positive.
2. Negative Covariance
Negative covariance occurs when one variable tends to increase while the other tends to decrease.
For example, in some datasets, physical activity and sedentary time may have a negative covariance if individuals who spend more time being physically active tend to spend less time being sedentary.
3. Covariance Close to Zero
A covariance close to zero indicates little evidence of a linear tendency for the two variables to vary together.
However, it is important to remember that zero covariance does not necessarily prove that two variables are completely unrelated. A nonlinear relationship may still exist.
ariance-Covariance Matrix
When more than one quantitative variable is analyzed, variances and covariances can be organized into a variance-covariance matrix.
For two variables, X and Y, the matrix is:
| X | Y | |
|---|---|---|
| X | Var(X) | Cov(X,Y) |
| Y | Cov(Y,X) | Var(Y) |
The important feature of this matrix is that:
Cov(X,Y) = Cov(Y,X)
Therefore, the variance-covariance matrix is symmetric.
What Do the Matrix Elements Mean?
The diagonal elements represent the variances:
- First diagonal element → variance of X
- Second diagonal element → variance of Y
The off-diagonal elements represent covariance:
- Cov(X,Y)
- Cov(Y,X)
For example:
| Variable | Height | Weight |
| Height | 36.0 | 42.5 |
| Weight | 42.5 | 100.0 |
Interpretation:
- Variance of Height = 36.0
- Variance of Weight = 100.0
- Covariance between Height and Weight = 42.5
Thus, the diagonal values describe individual variability, while the off-diagonal values describe joint variability.
Step-by-Step Example of Covariance
Consider the following hypothetical biological dataset containing height and weight measurements for five individuals.
| Person | Height (X) | Weight (Y) |
| 1 | 160 | 55 |
| 2 | 165 | 60 |
| 3 | 170 | 65 |
| 4 | 175 | 70 |
| 5 | 180 | 75 |
We can calculate the covariance step by step.
Step 1: Calculate the Mean of X
The mean height is:
x̄ = (160 + 165 + 170 + 175 + 180) / 5
x̄ = 170
Therefore, the average height is 170 cm.
Step 2: Calculate the Mean of Y
The mean weight is:
ȳ = (55 + 60 + 65 + 70 + 75) / 5
ȳ = 65
Therefore, the average weight is 65 kg.
Step 3: Calculate Deviations From the Mean
Now subtract the mean from every observation.
| Height (X) | Weight (Y) | X − x̄ | Y − ȳ | Product |
| 160 | 55 | −10 | −10 | 100 |
| 165 | 60 | −5 | −5 | 25 |
| 170 | 65 | 0 | 0 | 0 |
| 175 | 70 | 5 | 5 | 25 |
| 180 | 75 | 10 | 10 | 100 |
| Total | 250 |
The sum of the products of deviations is 250.
Step 4: Calculate Covariance
Because this is a sample, divide by n − 1.
sₓᵧ = 250 / (5 − 1)
sₓᵧ = 250 / 4
sₓᵧ = 62.5
Therefore:
Sample covariance = 62.5
The covariance is positive, indicating that height and weight increase together in this example.
Step 4: Calculate Covariance
Because this is a sample, divide by n − 1.
sₓᵧ = 250 / (5 − 1)
sₓᵧ = 250 / 4
sₓᵧ = 62.5
Therefore:
Sample covariance = 62.5
The covariance is positive, indicating that height and weight increase together in this example.
Variance vs Covariance
| Feature | Variance | Covariance |
| Number of variables | One | Two |
| Main purpose | Measures variability | Measures joint variation |
| Possible sign | Always non-negative | Positive, negative, or zero |
| Units | Squared units | Product of two units |
| Measures | Spread around the mean | Direction of joint variation |
| Example | Variation in blood pressure | Height and weight variation |
| Matrix position | Diagonal | Off-diagonal |
Covariance vs Correlation
Covariance and correlation are closely related but should not be considered identical.
Covariance measures the direction of joint variation between two variables, but its magnitude depends on the measurement units.
Correlation is a standardized version of covariance.
The Pearson correlation coefficient is:
r = Cov(X,Y) / (sₓ × sᵧ)
Correlation generally ranges from −1 to +1.
| Correlation value | General interpretation |
| +1 | Perfect positive linear relationship |
| 0 | No linear correlation |
| −1 | Perfect negative linear relationship |
For example, if height and weight have a positive covariance, their correlation may also be positive. However, the correlation coefficient is easier to compare across datasets because it is unit-free.
Applications of Variance-Covariance in Biostatistics
Variance-covariance information has numerous applications in biological and medical research.
1. Multivariate Analysis
Biological datasets often contain multiple measurements simultaneously. The variance-covariance matrix helps describe both individual variability and relationships among variables.
2. Principal Component Analysis
PCA uses the covariance or correlation structure of variables to identify major patterns and reduce the dimensionality of complex datasets.
For example, researchers may use PCA to analyze multiple biochemical measurements simultaneously.
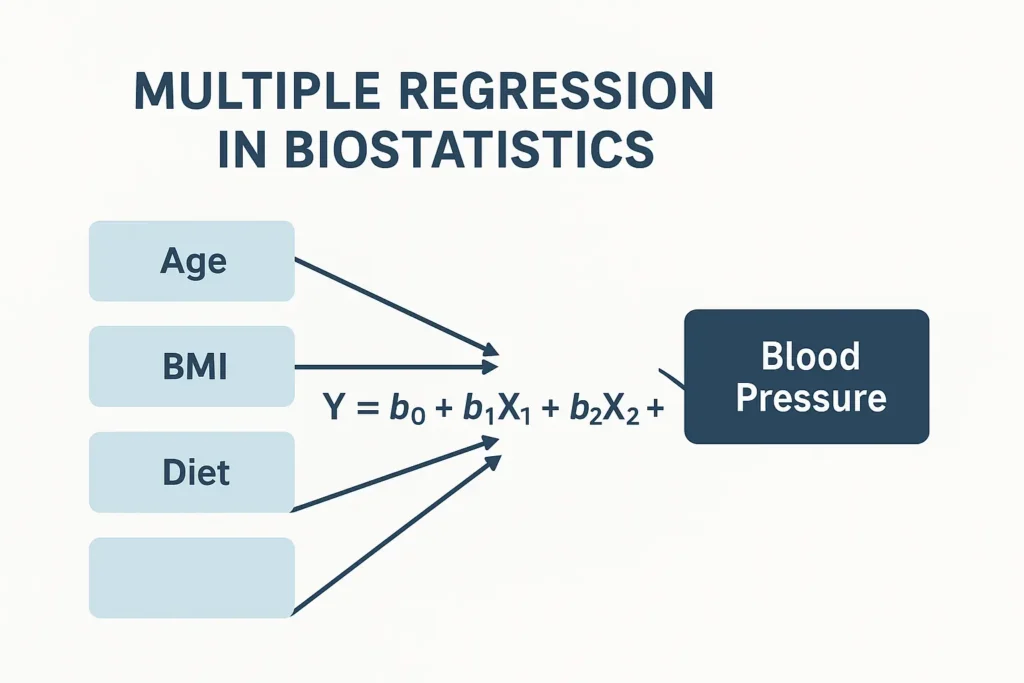
3. Multiple Regression
In regression analysis, covariance among predictor variables is important for understanding relationships between explanatory variables and for evaluating model estimates.
4. Repeated-Measures Studies
In clinical and biomedical research, measurements may be collected repeatedly from the same individual. These observations can be correlated, and covariance structures help describe their dependence.
5. Genetic and Biological Studies
Researchers may examine covariance between biological traits, phenotypic characteristics, or other quantitative measurements.
6. Environmental and Ecological Research
Variance-covariance methods can also be applied when researchers study relationships among environmental variables, species measurements, soil properties, or ecological indicators.
Simple Conceptual Figure
Figure 1. Relationship Between Variance, Covariance and the Variance-Covariance Matrix
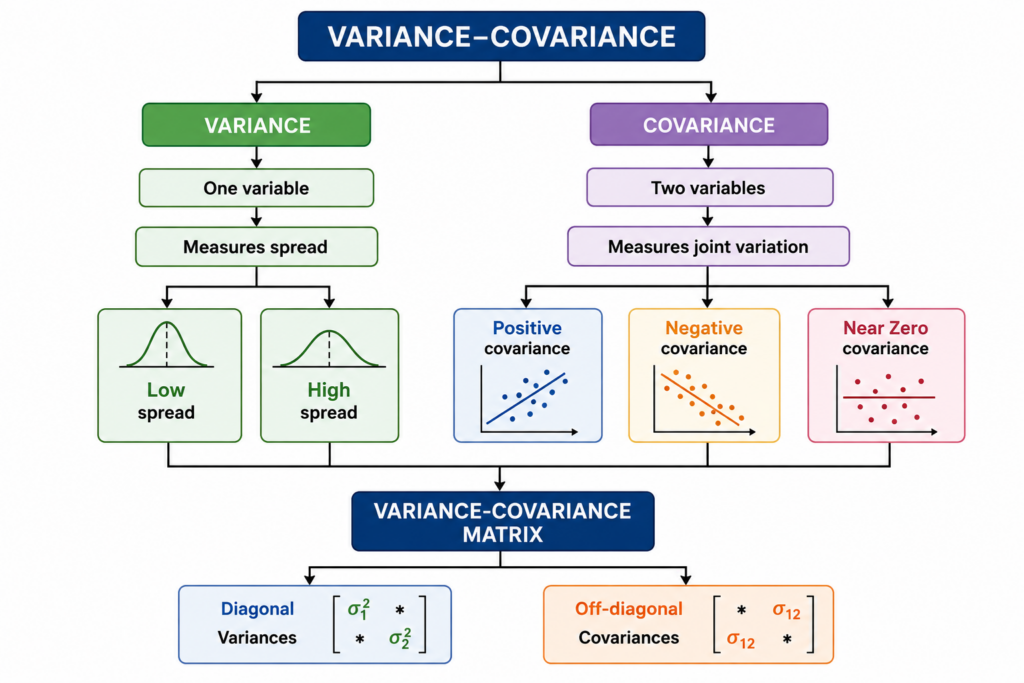
This figure provides a simple visual representation of how variance and covariance contribute to a variance-covariance matrix.
Conclusion
Variance-covariance is a fundamental concept in biostatistics that helps researchers understand variability and relationships among quantitative variables. Variance describes how individual observations are distributed around their mean, whereas covariance describes how two variables change together.
The variance-covariance matrix combines these two concepts into a structured mathematical representation. Variances occupy the diagonal positions, while covariances occupy the off-diagonal positions.
In biostatistical research, variance-covariance information is particularly important in multivariate analysis, multiple regression, principal component analysis, repeated-measures studies, biomedical research, genetics, and ecological studies.
Although covariance provides useful information about the direction of joint variation, its magnitude depends on measurement units. Therefore, researchers often use correlation when they need a standardized measure of linear association.
A clear understanding of variance and covariance provides an important foundation for more advanced statistical methods and helps students and researchers correctly interpret complex biological and medical datasets.