
Introduction
Meta-analysis is a statistical technique used to combine the results of multiple independent studies to obtain a more precise estimate of an effect size. In diagnostic research, the Area Under the Receiver Operating Characteristic Curve (AUC) is one of the most commonly used measures to evaluate the performance of a diagnostic test.
The Meta-Analysis Area Under ROC Curve (AUC) procedure in MedCalc allows researchers to pool AUC values reported across different studies and estimate an overall diagnostic accuracy measure.
This tutorial explains the concept, data structure, MedCalc options, forest plot interpretation, funnel plot interpretation, and complete result interpretation using a biomedical example dataset.
What is Area Under ROC Curve (AUC)?
The Area Under the ROC Curve (AUC) measures how well a diagnostic test can distinguish between diseased and non-diseased individuals.
AUC Interpretation
| AUC Value | Diagnostic Performance |
|---|---|
| 0.50 | No discrimination |
| 0.60 – 0.70 | Poor |
| 0.70 – 0.80 | Fair |
| 0.80 – 0.90 | Good |
| >0.90 | Excellent |
Higher AUC values indicate better diagnostic performance.
Concept of Meta-Analysis of AUC
Instead of relying on a single study, researchers combine AUC values from several studies.
Benefits include:
- Increased statistical power
- Improved precision
- Better clinical evidence
- Reduced uncertainty
- Stronger conclusions
The pooled AUC represents the overall diagnostic performance across all included studies.
Biomedical Example Dataset
Suppose eight studies evaluated a blood biomarker for detecting cardiovascular disease.
| Study | AUC | Standard Error |
|---|---|---|
| Study 1 | 0.780 | 0.040 |
| Study 2 | 0.820 | 0.035 |
| Study 3 | 0.850 | 0.030 |
| Study 4 | 0.800 | 0.038 |
| Study 5 | 0.870 | 0.028 |
| Study 6 | 0.830 | 0.032 |
| Study 7 | 0.810 | 0.036 |
| Study 8 | 0.840 | 0.031 |
How to Perform Meta-Analysis AUC in MedCalc
Step 1
Open MedCalc.
Step 2
Prepare three columns:
- Study
- AUC
- Standard Error
Step 3
Select:
Statistics → Meta-analysis → Area under ROC curve
Step 4
Assign variables:
- Studies → Study
- Area under ROC curve (AUC) → AUC
- Standard error of AUC → Standard Error
Step 5
Select plotting options.
Step 6
Click OK.
MedCalc generates:
- Forest Plot
- Funnel Plot
- Heterogeneity Statistics
- Publication Bias Tests
Explanation of MedCalc Options
Forest Plot
Displays individual study AUC values and pooled estimate.
Marker Size Relative to Study Weight
Larger squares indicate studies with greater weight.
Fixed Effect Model Weights
Assumes all studies estimate the same true AUC.
Use when heterogeneity is minimal.
Random Effect Model Weights
Assumes study-to-study variation exists.
Recommended for most biomedical meta-analyses.
Plot Pooled Effect – Fixed Effects Model
Shows pooled AUC using the fixed effect approach.
Plot Pooled Effect – Random Effects Model
Shows pooled AUC using the random effect approach.
Diamonds for Pooled Effects
Displays pooled estimate as a diamond.
Diamond width = 95% confidence interval.
Funnel Plot
Used to assess publication bias.
Symmetrical funnel shape suggests low bias.
Meta-Analysis Results
According to your MedCalc output:
| Model | Pooled AUC | 95% CI | P-value |
|---|---|---|---|
| Fixed Effect | 0.831 | 0.808 – 0.854 | <0.001 |
| Random Effect | 0.831 | 0.808 – 0.854 | <0.001 |
The pooled AUC was 0.831, indicating good diagnostic performance across all included studies.
Forest Plot Interpretation
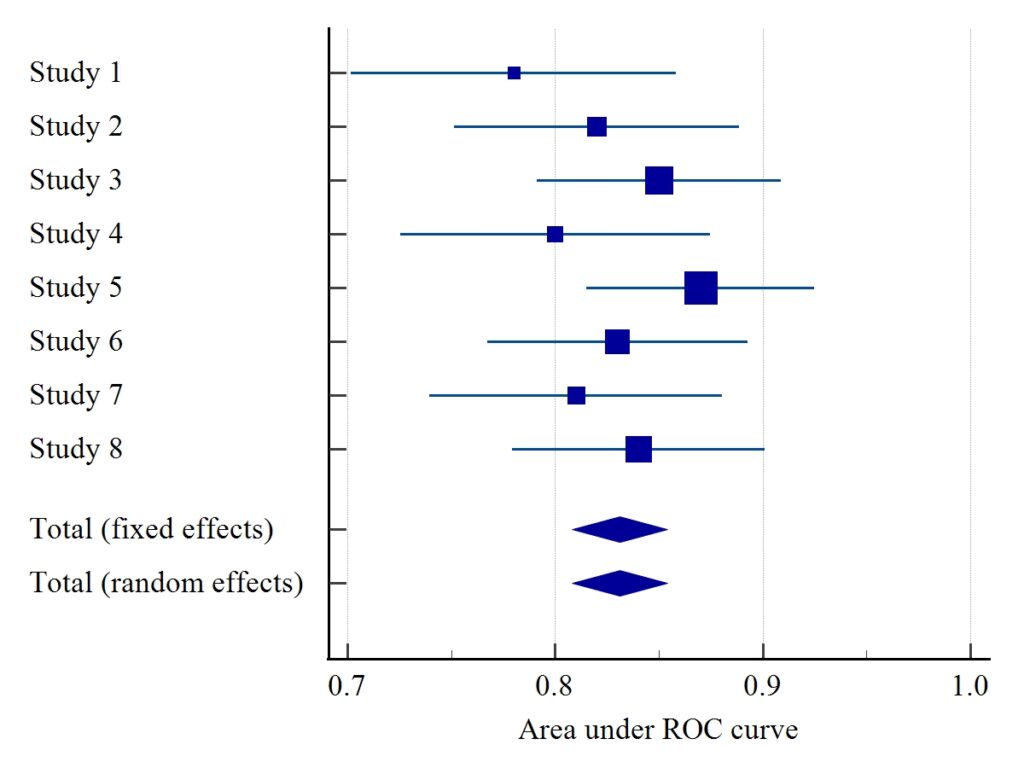
- Individual study AUC values ranging from 0.780 to 0.870.
- Most studies cluster around 0.80–0.87.
- Confidence intervals overlap substantially.
- The pooled diamond is centered at approximately 0.831.
Interpretation:
The biomarker demonstrates consistently good diagnostic accuracy across studies.
Heterogeneity Analysis
Results
| Statistic | Value |
|---|---|
| Q | 5.1565 |
| DF | 7 |
| P-value | 0.6409 |
| I² | 0.00% |
Interpretation
Q Statistic
Q = 5.1565
Tests whether variation among studies exceeds chance.
Heterogeneity P-value
P = 0.6409
Because P > 0.05:
There is no statistically significant heterogeneity.
I² Statistic
I² = 0%
Interpretation:
| I² | Interpretation |
|---|---|
| 0–25% | Low |
| 25–50% | Moderate |
| 50–75% | High |
| >75% | Very High |
Your result indicates virtually no heterogeneity.
Funnel Plot Interpretation
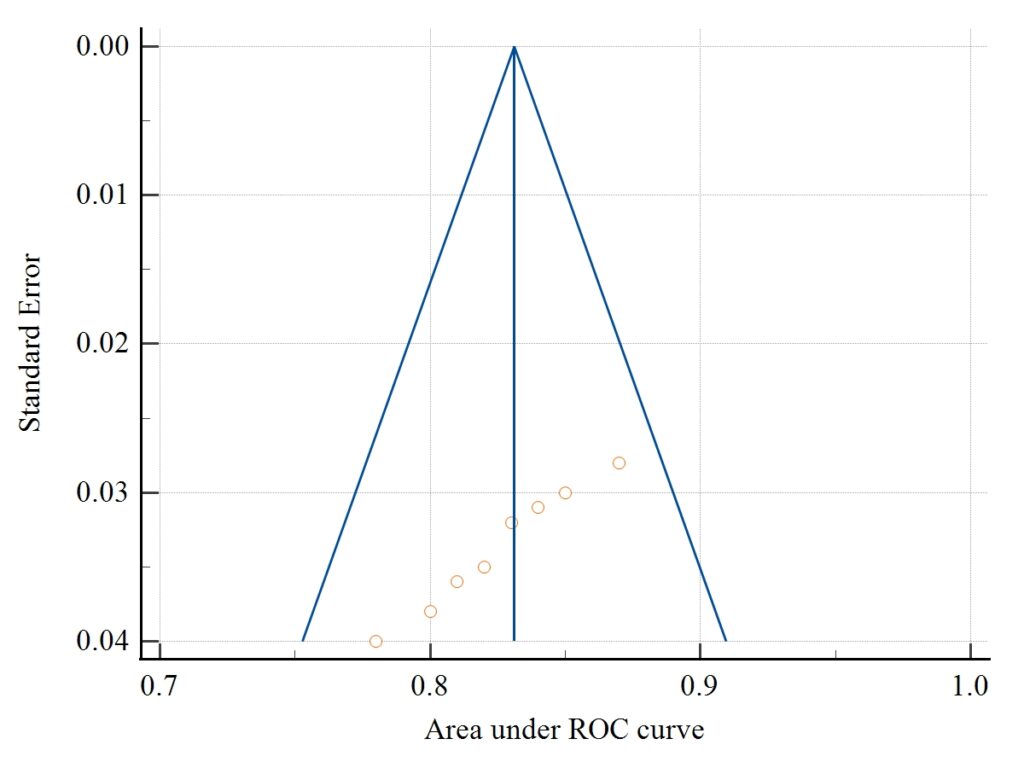
The funnel plot assesses publication bias.
In your analysis:
- Studies are distributed around the pooled effect.
- Some asymmetry is visible.
- Publication bias tests were performed.
Egger’s Test
| Statistic | Value |
|---|---|
| Intercept | -6.9187 |
| P-value | <0.0001 |
Interpretation
Because P < 0.05:
Egger’s test suggests possible publication bias.
Begg’s Test
| Statistic | Value |
|---|---|
| Kendall Tau | -1.0000 |
| P-value | 0.0005 |
Interpretation
Begg’s test also indicates potential publication bias.
Result Summary Table
| Parameter | Result |
|---|---|
| Number of Studies | 8 |
| Pooled AUC | 0.831 |
| 95% CI | 0.808 – 0.854 |
| Overall Significance | <0.001 |
| Heterogeneity P-value | 0.6409 |
| I² | 0% |
| Egger’s Test | Significant |
| Begg’s Test | Significant |
Based on these findings, the diagnostic biomarker demonstrates good overall accuracy, although publication bias should be considered.
Conclusion
Meta-Analysis Area Under ROC Curve (AUC) in MedCalc is a powerful method for combining diagnostic accuracy studies. In this example, the pooled AUC was 0.831, indicating good diagnostic performance. The heterogeneity analysis showed no significant variation among studies (I² = 0%), while funnel plot assessments suggested possible publication bias. Researchers can use this approach to summarize diagnostic evidence and improve clinical decision-making based on multiple independent studies.



