
Introduction
Spectral analysis is a powerful statistical technique used to identify hidden periodic patterns within a time-series dataset. Rather than examining changes over time directly, spectral analysis transforms the data into the frequency domain, allowing researchers to determine which frequencies contribute most to the observed variation. One of the simplest and most widely used spectral analysis methods is the Simple Periodogram.
The Simple Periodogram estimates how the variance of a time series is distributed across different frequencies. Peaks in the periodogram indicate dominant cycles or periodic components within the data. This technique is widely used in biology, ecology, environmental science, climatology, medicine, economics, engineering, and many other scientific disciplines.
The PAST (Paleontological Statistics) software provides an easy-to-use platform for performing spectral analysis without requiring programming knowledge. With only a few clicks, researchers can visualize dominant frequencies, evaluate statistical significance, and interpret periodic behavior in experimental data.
What is a Simple Periodogram?
A Simple Periodogram is a graphical representation of spectral density where:
- X-axis represents Frequency.
- Y-axis represents Spectral Power.
- Higher peaks indicate stronger periodic signals.
- Random noise generally appears as low power values.
The objective of a periodogram is to determine whether a dataset contains statistically significant cyclic or repeating patterns.
Why Use a Simple Periodogram?
Simple Periodograms are useful for:
- Detecting cyclic biological processes
- Identifying seasonal variation
- Finding rhythmic environmental patterns
- Detecting oscillatory behavior
- Frequency-domain analysis of time-series data
- Signal processing applications
Applications in Biological Research
Simple Periodograms are commonly used in:
- Circadian rhythm studies
- Population ecology
- Environmental monitoring
- Climate variability
- Heart rate variability
- EEG signal analysis
- Animal behavioral studies
- Plant growth monitoring
- Fisheries research
- Epidemiological time-series studies
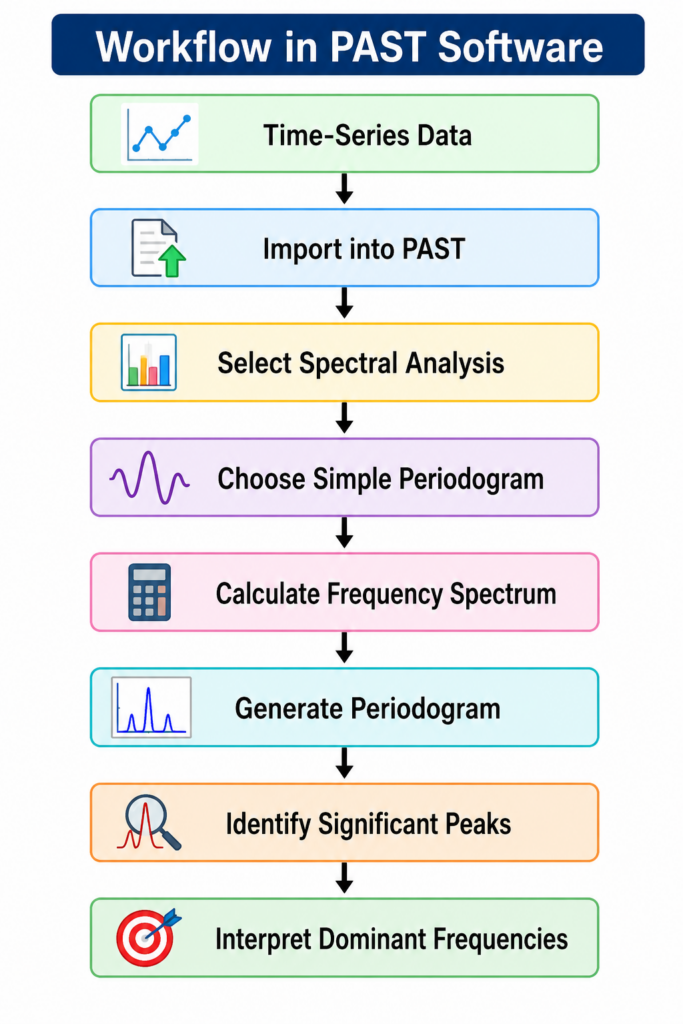
Components of a Periodogram
| Component | Description |
|---|---|
| Frequency | Number of cycles per observation unit |
| Spectral Power | Strength of the frequency component |
| Peak | Dominant periodic signal |
| Significance Line | Threshold indicating statistically significant frequencies |
| Random Noise | Background fluctuations with low power |
Understanding the Output Figure
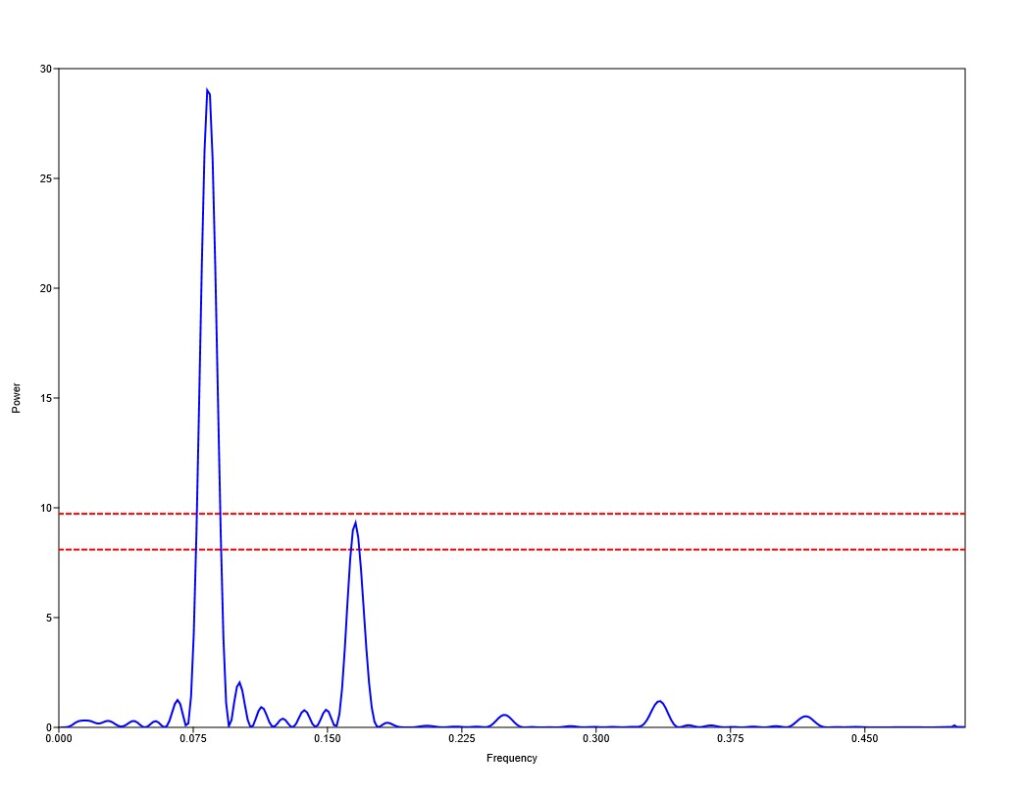
- A very prominent peak occurs near Frequency = 0.08283.
- Peak spectral power reaches approximately 29.02, which is substantially higher than the significance thresholds.
- A second smaller peak appears around 0.166, with power close to 9.3.
- Two dashed horizontal lines indicate the p < 0.01 and p < 0.05 significance thresholds.
- Most remaining frequencies exhibit very low power, indicating limited contribution to overall variance.
The frequency-power data also confirms the dominant peak around frequency 0.082831 with power 29.016, followed by a secondary peak around 0.16566 with power 9.3162.
Interpretation of the Results
The graphical output indicates that the strongest periodic signal occurs at a frequency of 0.08283, where the spectral power reaches 29.02. This value is considerably greater than both the p < 0.01 significance line (9.729) and the p < 0.05 significance line (8.094) shown in the PAST output, suggesting a highly significant periodic component. The reported randomization probability (p = 4.206 × 10⁻¹¹) provides very strong evidence against the null hypothesis of random variation. The output panel also reports these summary statistics directly.
A secondary peak is visible near frequency 0.16566, with spectral power of approximately 9.316, which exceeds the p < 0.05 threshold but remains below the p < 0.01 threshold shown in the figure, indicating a weaker yet notable periodic component.
Overall, the periodogram suggests that the dataset is dominated by one principal repeating cycle, while additional frequencies contribute relatively little to the total variance.
Result Summary Table
| Parameter | Value | Interpretation |
|---|---|---|
| Analysis Method | Simple Periodogram | Frequency-domain analysis |
| Peak Frequency | 0.08283 | Dominant periodic component |
| Maximum Spectral Power | 29.02 | Very strong signal |
| Randomization p-value | 4.206 × 10⁻¹¹ | Highly significant |
| p < 0.01 Threshold | 9.729 | Main peak exceeds threshold |
| p < 0.05 Threshold | 8.094 | Main peak exceeds threshold |
| Secondary Peak | ≈0.166 | Moderate periodic component |
| Overall Result | Significant periodicity detected | Strong cyclic behavior |
Interpretation Table
| Observation | Interpretation |
|---|---|
| Highest spectral peak | Indicates the strongest repeating pattern in the dataset |
| Peak exceeds significance lines | The dominant cycle is statistically significant |
| Very small p-value | Strong evidence against randomness |
| Secondary peak present | Suggests an additional, weaker periodic component |
| Low power at remaining frequencies | Most frequencies contribute minimally to variance |
Figure Caption
Figure 1. Simple Periodogram generated using PAST Statistical Software. The blue line represents spectral power across frequencies. Red dashed lines indicate the statistical significance thresholds (p < 0.05 and p < 0.01). A dominant peak at approximately 0.08283 demonstrates the strongest periodic signal within the dataset.
Advantages of Simple Periodogram
- Easy to compute and interpret
- Detects hidden periodic patterns
- Useful for biological time-series analysis
- Graphical visualization of dominant frequencies
- Identifies statistically significant cycles
- Available in user-friendly software such as PAST
Limitations
- Sensitive to noise
- Frequency resolution depends on sample size
- Spectral leakage may occur
- Assumes evenly spaced observations
- Does not directly identify time-varying frequencies
Conclusion
The Simple Periodogram is an essential tool for spectral analysis and frequency-domain investigation of time-series data. Using PAST Statistical Software, researchers can efficiently identify dominant periodic components and assess their statistical significance. In the uploaded analysis, the periodogram revealed a highly significant dominant frequency (0.08283) with maximum spectral power of 29.02, greatly exceeding both significance thresholds, indicating a strong periodic signal within the dataset. A secondary peak near 0.166 suggests an additional but weaker oscillatory component. Overall, the results demonstrate that the observed variation is driven primarily by one major repeating cycle rather than random fluctuations, making the Simple Periodogram a valuable method for biological, ecological, environmental, and other scientific time-series investigations.



