
Introduction
Biodiversity is generally studied at three hierarchical levels: alpha diversity (α-diversity), beta diversity (β-diversity), and gamma diversity (γ-diversity). While alpha diversity measures species richness within a single habitat, beta diversity evaluates the differences in species composition among habitats or sampling sites. Gamma diversity represents the total diversity across a larger geographical region.
Beta diversity has become one of the most important ecological measures because it helps researchers understand species turnover, habitat heterogeneity, environmental gradients, and ecosystem functioning. It provides valuable insights into how biological communities change across landscapes due to environmental conditions, disturbance, climate change, or human activities.
The PAST (Paleontological Statistics) software is one of the most popular free statistical packages for ecological and biodiversity analyses. It contains several beta diversity indices including Whittaker, Harrison, Cody, Routledge, Wilson-Shmida, Mourelle, Harrison 2, and Williams indices, allowing researchers to compare community composition efficiently.
This article explains the concept of beta diversity, commonly used indices, interpretation of PAST output, and ecological significance.
What is Beta Diversity?
Beta diversity refers to the variation in species composition between different habitats, sampling sites, or communities.
Unlike alpha diversity, which focuses on species richness within one site, beta diversity quantifies how much communities differ from one another.
Mathematically,
Beta Diversity = Difference in species composition among communities
Higher beta diversity indicates greater differences between communities, whereas lower beta diversity indicates that communities share many of the same species.
Objectives of Beta Diversity
Beta diversity is used to:
- Compare ecological communities
- Measure species turnover
- Identify habitat heterogeneity
- Evaluate ecosystem health
- Study environmental gradients
- Assess conservation priorities
- Detect habitat fragmentation effects
Concept of Beta Diversity
The concept can be illustrated as follows.
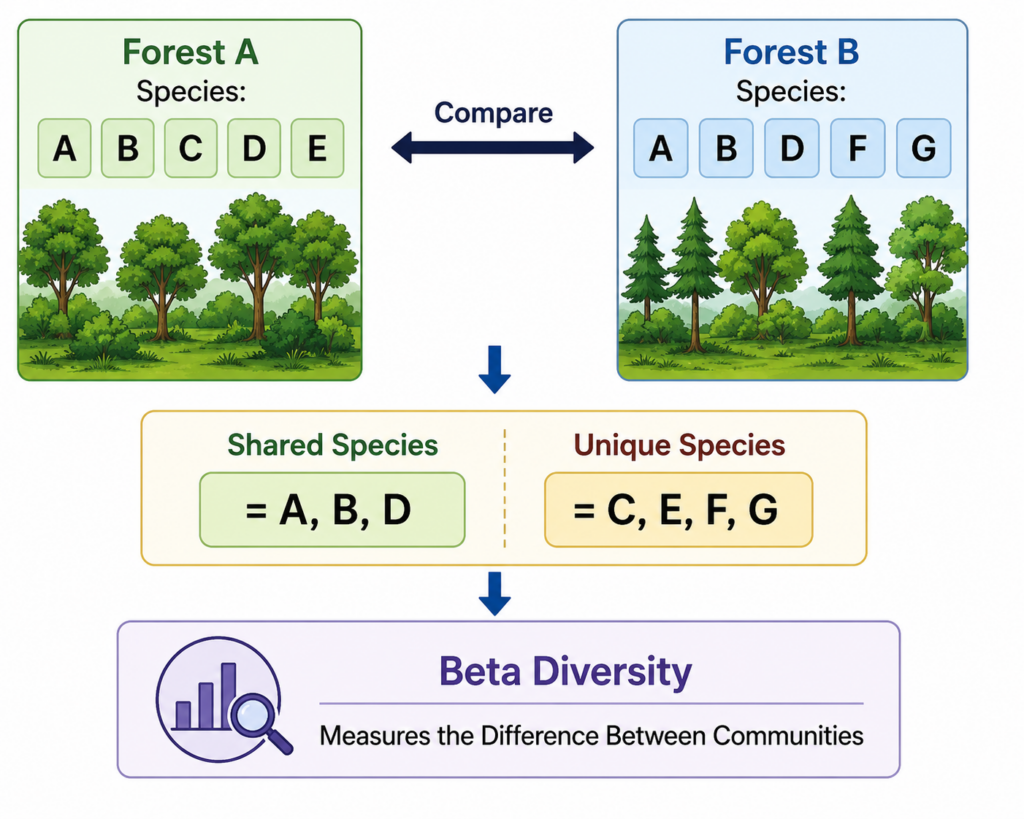
When two communities contain exactly the same species, beta diversity is very low.
When they contain completely different species, beta diversity becomes high.
Common Beta Diversity Indices Available in PAST
| Index | Purpose | Interpretation |
|---|---|---|
| Whittaker | Species turnover | Most commonly used |
| Harrison | Community differentiation | Low values indicate similarity |
| Cody | Species replacement | Higher value = greater turnover |
| Routledge | Community variation | Sensitive to species distribution |
| Wilson-Shmida | Species replacement | Measures gain and loss |
| Mourelle | Habitat differentiation | Community heterogeneity |
| Harrison 2 | Modified Harrison index | Standardized comparison |
| Williams | Community dissimilarity | Relative turnover |
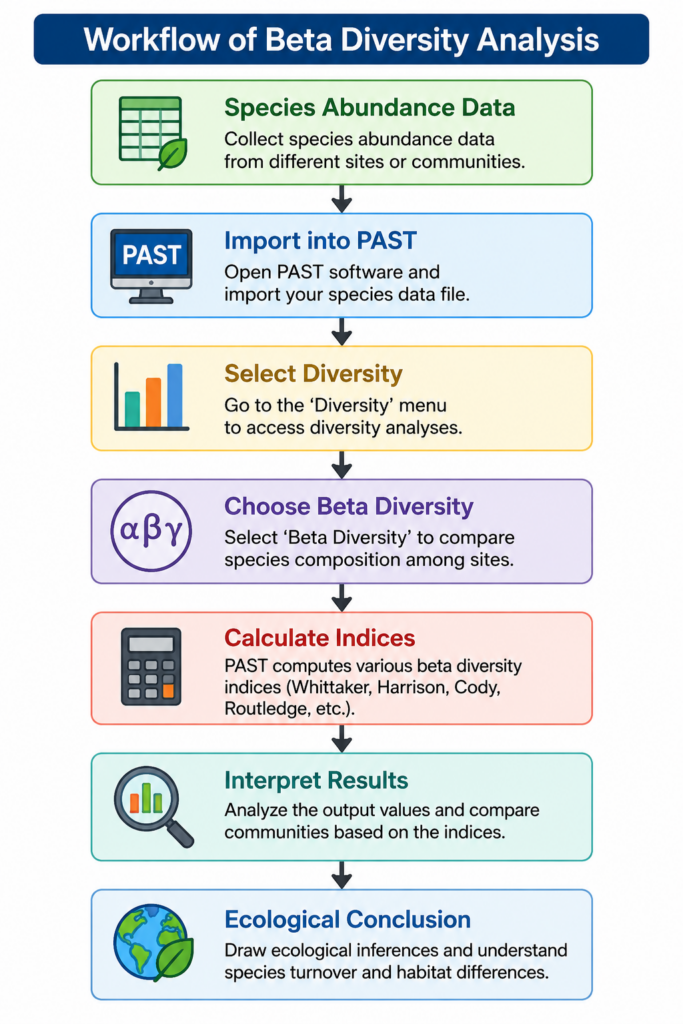
Workflow of Beta Diversity Analysis
Beta Diversity Results Obtained from PAST
The uploaded PAST output produced the following global beta diversity values.
| Beta Diversity Index | Value | Interpretation |
|---|---|---|
| Whittaker | 0.25156 | Low to moderate species turnover among communities |
| Harrison | 0.010482 | Very low community differentiation |
| Cody | 111.5 | High cumulative species replacement across sampling sites |
| Routledge | 0.086333 | Low ecological variation between communities |
| Wilson-Shmida | 3.4887 | Moderate species gain and loss among communities |
| Mourelle | 0.14536 | Low habitat differentiation |
| Harrison 2 | 0.0010684 | Extremely low standardized turnover |
| Williams | 0.025 | Very low community dissimilarity |
Interpretation of the Results
The Whittaker beta diversity value (0.25156) indicates low to moderate variation in species composition among the sampling communities. Approximately one-quarter of the species composition changes between sites, suggesting that many species are shared.
The Harrison index (0.010482) is extremely small, indicating that the sampled communities are highly similar with minimal differentiation.
The Cody index (111.5) is relatively high because this index measures the cumulative number of species replacements across all comparisons. This suggests that although overall similarity is high, species replacement occurs repeatedly among individual sampling locations.
The Routledge index (0.086333) indicates low community variation and suggests that ecological conditions are relatively homogeneous.
The Wilson-Shmida index (3.4887) demonstrates moderate species turnover resulting from both species gain and species loss across sites.
The Mourelle index (0.14536) also indicates relatively low habitat differentiation.
The Harrison 2 value (0.0010684) confirms that standardized species turnover among communities is extremely small.
Finally, the Williams index (0.025) suggests that the overall dissimilarity among communities is minimal.
Overall, these indices consistently indicate that the sampled communities share a large proportion of species, with only moderate localized species replacement.
Pairwise Beta Diversity Matrix
The uploaded pairwise beta diversity matrix shows comparisons among 25 species (Species 1–Species 25). Most pairwise values fall between approximately 0.00 and 0.24, indicating generally low dissimilarity among species/community comparisons. Only a few pairs approach higher values (~0.24), suggesting localized differences, whereas many pairs are close to zero, reflecting high similarity in species composition.
Example comparisons from the matrix
| Comparison | Beta Diversity |
|---|---|
| Species 1 vs Species 2 | 0.11429 |
| Species 1 vs Species 3 | 0.16667 |
| Species 5 vs Species 9 | 0.24324 |
| Species 15 vs Species 16 | 0.03030 |
| Species 19 vs Species 20 | 0.00000 |
These comparisons indicate that some species pairs are highly similar (values near 0), while others show moderate differences, supporting the overall conclusion of low to moderate beta diversity across the dataset.
Ecological Importance of Beta Diversity
Beta diversity is widely applied in ecological and environmental research.
Major applications include:
- Forest biodiversity assessment
- Wildlife conservation planning
- Climate change studies
- Restoration ecology
- Agricultural biodiversity
- Marine ecology
- Freshwater ecology
- Landscape ecology
- Microbial ecology
- Environmental impact assessment
Advantages of Using PAST Software
- Completely free software
- Easy graphical interface
- Multiple beta diversity indices
- Fast calculations
- Suitable for ecological datasets
- Publication-quality statistical analyses
- Supports abundance and presence/absence data
- Widely accepted in ecological research
Conclusion
Beta diversity is an essential ecological measure that quantifies differences in species composition among communities and provides valuable information on species turnover and habitat heterogeneity. PAST Statistical Software offers a comprehensive set of beta diversity indices—including Whittaker, Harrison, Cody, Routledge, Wilson–Shmida, Mourelle, Harrison 2, and Williams—making it a practical tool for biodiversity research.
Based on the uploaded results, the dataset shows generally low to moderate beta diversity, with most indices indicating high similarity among communities and limited overall species turnover. Although the Cody index suggests considerable cumulative species replacement across comparisons, the remaining indices consistently support the conclusion that the sampled communities share many species and exhibit relatively homogeneous ecological conditions. These findings demonstrate that PAST provides a robust framework for interpreting community structure, comparing habitats, and supporting ecological conservation and biodiversity monitoring.



