Introduction
Biostatistics plays an important role in biology, medicine, agriculture, zoology, botany, and other life-science disciplines. Researchers frequently collect numerical data and need statistical methods to determine whether observed differences are meaningful or simply due to random variation. One of the most widely used statistical methods for this purpose is the Student’s t-test.
The Student’s t-test is a fundamental statistical test used to compare means between groups or to compare a sample mean with a known or hypothesized value. It is particularly useful when the sample size is relatively small and the population standard deviation is unknown.
Understanding the t-test provides an essential foundation for learning more advanced statistical methods such as analysis of variance (ANOVA), regression, and other inferential statistical techniques.
What is Student’s t-Test?
The Student’s t-test is a statistical hypothesis test used to determine whether there is a statistically significant difference between two means.
The test was developed from the work of William Sealy Gosset, who published under the pseudonym “Student.” The method became particularly important for statistical analysis involving small samples.
In simple terms, the t-test helps answer a question such as:
“Is the difference between these two average values large enough to be considered statistically significant?”
For example, a researcher may want to determine whether a treatment significantly changes the average body weight of experimental animals compared with a control group.
Fundamental Concept of the t-Test
The basic idea behind the t-test is to compare the observed difference between means with the amount of variation expected within the data.
If the difference between the means is large relative to the variability, the calculated t-value will generally be larger. A sufficiently large t-value provides evidence against the null hypothesis.
The two important hypotheses are:
- Null hypothesis (H₀): There is no significant difference between the means.
- Alternative hypothesis (H₁): There is a significant difference between the means.
The researcher then calculates a t-value and determines its statistical significance using the corresponding degrees of freedom and p-value.
Types of Student’s t-Test
There are three commonly used forms of the t-test:
1. One-Sample t-Test
A one-sample t-test compares the mean of a single sample with a known or hypothesized population mean.
Example:
A researcher records the average body length of 15 insects and wants to determine whether it differs significantly from a previously established mean of 20 mm.
2. Independent Samples t-Test
An independent samples t-test compares the means of two separate and unrelated groups.
Example:
A researcher compares the average growth rate of plants treated with fertilizer A with plants treated with fertilizer B.
3. Paired Samples t-Test
A paired samples t-test compares two measurements obtained from the same experimental units.
Example:
A researcher measures the body weight of the same animals before and after treatment.
Student’s t-Test: Step-by-Step Procedure
Step 1: State the Hypotheses
First, establish the null and alternative hypotheses.
For example:
H₀: There is no significant difference between the mean growth of Group A and Group B.
H₁: There is a significant difference between the mean growth of Group A and Group B.
Step 2: Select the Significance Level
The commonly selected significance level is 5% (α = 0.05).
In some studies, researchers may also use 1% (α = 0.01), particularly when stronger evidence is required.
Step 3: Calculate the Group Means
Calculate the arithmetic mean for each group:
Mean = ΣX / n
where:
- ΣX = sum of observations
- n = number of observations
Step 4: Calculate the t-Value
The appropriate t-test formula depends on the type of t-test being performed.
For two independent groups, the general concept is:
t = Difference between group means / Standard error of the difference
The exact formula should be selected according to whether equal variances can be assumed and according to the study design.
Step 5: Determine Degrees of Freedom
Degrees of freedom (df) depend on the type of t-test and sample size.
For a simple independent-samples t-test with equal variance assumptions:
df = n₁ + n₂ − 2
Step 6: Obtain the p-Value
The calculated t-value is used to determine the corresponding p-value.
The p-value indicates how compatible the observed result is with the null hypothesis.
Step 7: Interpret the Result
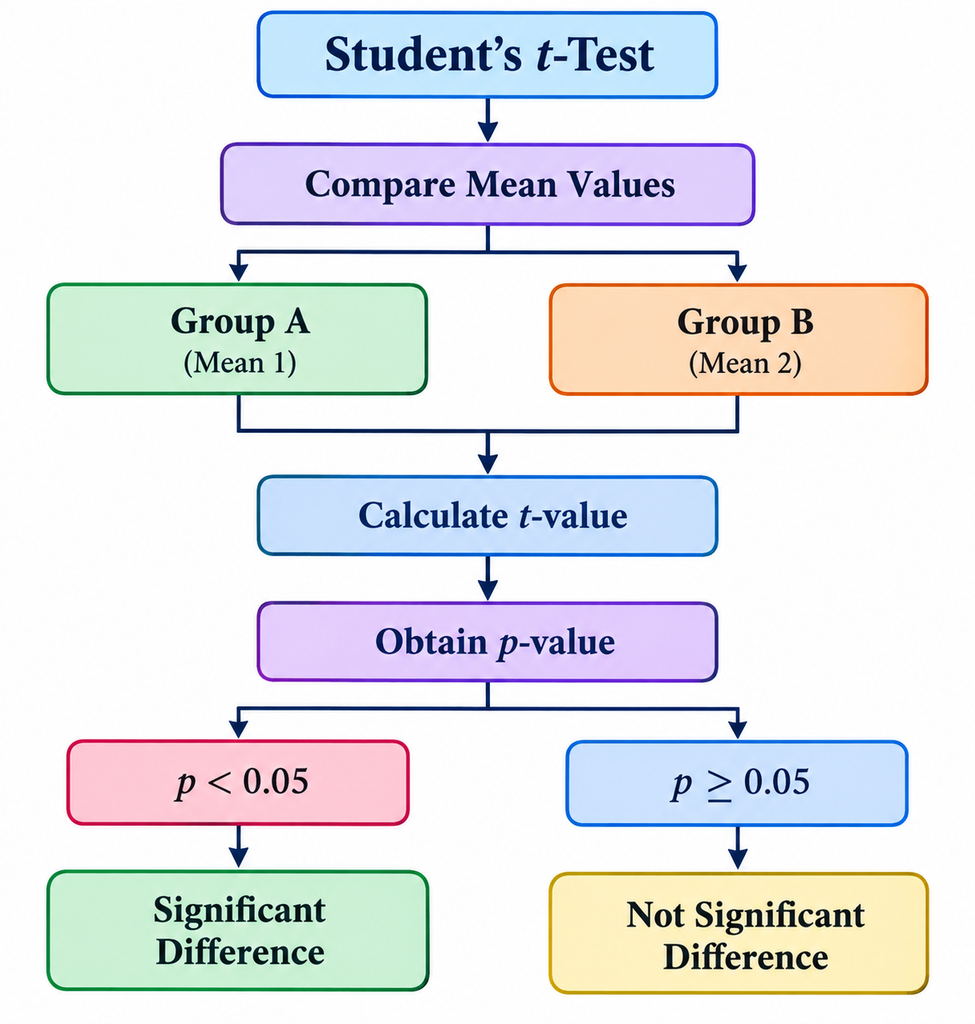
A commonly used decision rule is:
- p < 0.05: statistically significant
- p ≥ 0.05: not statistically significant
If p < 0.05, the null hypothesis is rejected and the result is considered statistically significant at the 5% level.
Example of Student’s t-Test in Biostatistics
Suppose a researcher investigates the effect of a particular treatment on the growth of laboratory organisms. The average growth measurements obtained from two independent groups are:
| Group | Sample Size (n) | Mean Growth | Standard Deviation |
|---|---|---|---|
| Control | 10 | 12.4 | 1.8 |
| Treatment | 10 | 15.1 | 2.0 |
The observed difference between the means is:
15.1 − 12.4 = 2.7 units
A suitable independent-samples t-test can then be performed to determine whether this difference is statistically significant.
Suppose the statistical analysis produces:
t = 3.14, df = 18, p = 0.0058
Because the p-value is less than 0.05, the difference between the two group means is statistically significant.
Therefore, the researcher may reject the null hypothesis and conclude that the treatment group showed a statistically significant difference in mean growth compared with the control group.
The numerical result in an actual research study should always be calculated from the complete dataset using an appropriate statistical procedure.
Interpretation of t-Test Results
A t-test result should not be interpreted solely by looking at whether the means are numerically different. Statistical significance considers both the magnitude of the difference and the variability within the observations.
For example:
| Result | Interpretation |
|---|---|
| p < 0.01 | Highly significant difference |
| p < 0.05 | Significant difference |
| p ≥ 0.05 | Not statistically significant |
Researchers should also report the mean difference, confidence interval, t-value, degrees of freedom, and p-value whenever appropriate.
Concept of Student’s t-Test
Assumptions of the Student’s t-Test
Before applying a t-test, researchers should consider its assumptions. Depending on the specific form of the test, these may include:
- The observations should be appropriately independent.
- The dependent variable should generally be quantitative.
- The data should be approximately normally distributed, particularly for small samples.
- For the traditional equal-variance independent t-test, the two populations should have approximately equal variances.
- The observations should be collected using an appropriate experimental or sampling design.
When equal variances cannot reasonably be assumed, Welch’s t-test is often a more suitable alternative for comparing two independent means.
Applications of Student’s t-Test in Biostatistics
The t-test has numerous applications in biological and medical research. It can be used to compare:
- Growth measurements between experimental groups
- Mean body weight between animal groups
- Blood or biochemical measurements between groups
- Plant characteristics under different treatments
- Physiological parameters before and after treatment
- Mean laboratory measurements with a reference value
- Experimental and control group observations
Because of its simplicity and usefulness, the t-test is frequently introduced as one of the first inferential statistical methods in biostatistics.
Advantages and Limitations
Advantages
The Student’s t-test is relatively simple to understand and calculate. It is especially useful for comparing means when sample sizes are small and the population standard deviation is unknown. It is also widely available in statistical software packages.
Limitations
The t-test is designed primarily for comparisons involving means. It may not be appropriate when data strongly violate its assumptions or when the study design involves more than two groups. For multiple-group comparisons, ANOVA is generally more appropriate than performing numerous separate t-tests.
Conclusion
The Student’s t-test is a fundamental tool in biostatistics for evaluating differences between means. It provides researchers with a systematic method for determining whether an observed difference is likely to represent a genuine effect rather than random variation.
Understanding the types of t-tests, hypotheses, significance level, t-value, degrees of freedom, p-value, assumptions, and interpretation is essential for students and researchers in the life sciences. Although simple, the t-test forms an important foundation for more advanced statistical analysis. Correct selection of the test and careful interpretation of its results are essential for producing reliable and scientifically meaningful conclusions.