Introduction
Alpha diversity (α-diversity) is one of the most fundamental concepts in biostatistics, ecology, environmental science, and microbiome research. It measures the diversity within a single habitat, ecosystem, or biological sample. Researchers use alpha diversity to determine how many species are present and how evenly they are distributed within a sample.
With the rapid advancement of DNA sequencing technologies, alpha diversity has become an essential statistical measure in microbiome studies, biodiversity assessments, conservation biology, agriculture, and medical research. Whether studying soil bacteria, gut microbiota, forest vegetation, or aquatic organisms, alpha diversity provides valuable insight into the complexity and health of biological communities.
This article explains alpha diversity step by step, including its definition, concept, common diversity indices, calculation methods, interpretation, examples, tables, and graphical illustrations.
What is Alpha Diversity?
Definition
Alpha diversity (α-diversity) is the statistical measurement of species diversity within a single ecosystem, community, or sample. It combines information about:
- Species richness (number of species)
- Species evenness (how equally individuals are distributed)
Unlike beta diversity and gamma diversity, alpha diversity focuses only on one sample or one location.
Simple Definition
Alpha diversity answers the question:
“How diverse is this one biological sample?”
For example,
A soil sample contains
- 15 bacterial species
- 800 bacterial individuals
Alpha diversity evaluates both
- How many species exist
- Whether one species dominates or all species are equally abundant
Understanding the Concept Step by Step
Step 1: Select One Sample
Suppose a researcher collects one soil sample.
This sample contains microorganisms belonging to different species.
↓
Step 2: Count Species
Suppose the sample contains
- Species A
- Species B
- Species C
- Species D
Total species = 4
This is called species richness.
↓
Step 3: Count Individuals
Now count individuals.
| Species | Individuals |
|---|---|
| A | 40 |
| B | 35 |
| C | 20 |
| D | 5 |
Total = 100
↓
Step 4: Evaluate Evenness
If all species have similar numbers,
the diversity becomes higher.
If one species dominates,
the diversity becomes lower.
↓
Step 5: Calculate Alpha Diversity Index
Several statistical indices can be used.
Examples include
- Shannon Index
- Simpson Index
- Chao1 Index
- ACE Index
- Fisher’s Alpha
- Observed Species
Components of Alpha Diversity
1. Species Richness
Species richness simply counts the number of different species.
Example
Sample A = 8 species
Sample B = 15 species
Sample B has greater richness.
2. Species Evenness
Evenness measures how equally individuals are distributed.
Example
Community A
25,25,25,25
Perfectly even.
Community B
97,1,1,1
Poor evenness.
Although both have four species,
Community A has much higher alpha diversity.
Common Alpha Diversity Indices
| Diversity Index | Measures | Interpretation |
|---|---|---|
| Observed Species | Number of species | Higher value = More species |
| Shannon Index | Richness + Evenness | Higher value = Greater diversity |
| Simpson Index | Dominance | Lower dominance = Higher diversity |
| Chao1 | Estimated richness | Predicts unseen species |
| ACE | Estimated abundance coverage | Useful for microbial studies |
| Fisher’s Alpha | Species abundance | Common in ecological research |
Shannon Diversity Index
The Shannon index is one of the most widely used alpha diversity measures.
Formula
H’ = −Σ(pi × ln pi)
Where
- pi = proportion of each species
- ln = natural logarithm
Higher values indicate
- more species
- better evenness
- greater biodiversity
Simpson Diversity Index
Formula
D = Σ(pi²)
Sometimes researchers report
1 − D
or
1 / D
Interpretation
- Higher diversity
- Lower dominance
- More balanced communities
Chao1 Richness Estimator
Chao1 estimates the number of species that may not have been observed.
Useful when
- sequencing depth is limited
- many rare species exist
- microbial communities are studied
Example
Suppose two soil samples were analyzed.
| Sample | Species Richness | Shannon Index | Simpson Index |
|---|---|---|---|
| Forest Soil | 28 | 3.25 | 0.92 |
| Agricultural Soil | 16 | 2.08 | 0.71 |
Interpretation
Forest soil has
- more species
- higher evenness
- greater microbial diversity
Agricultural soil shows lower diversity.
Practical Example
Imagine two gardens.
Garden A
Flowers
- Rose
- Jasmine
- Sunflower
- Lily
- Hibiscus
Each has about 20 plants.
Very high diversity.
Garden B
Flowers
Rose = 95 plants
Others = 1–2 plants
Although five species exist,
one dominates.
Alpha diversity is much lower.
Applications of Alpha Diversity
Alpha diversity is widely used in
- Microbiome analysis
- Human gut microbiota
- Soil microbial ecology
- Marine biology
- Forest ecology
- Agriculture
- Environmental monitoring
- Wildlife conservation
- Cancer microbiome studies
- Plant biodiversity assessment
Advantages
- Easy to calculate
- Measures community complexity
- Supports biodiversity comparison
- Widely accepted in ecological research
- Useful in sequencing studies
- Helps monitor environmental health
Limitations
- Evaluates only one sample at a time
- Does not compare communities directly
- Sensitive to sampling effort
- Rare species may influence estimates
- Different indices may produce different interpretation
Difference Between Richness and Alpha Diversity
| Feature | Species Richness | Alpha Diversity |
|---|---|---|
| Counts species | Yes | Yes |
| Measures evenness | No | Yes |
| Statistical index | No | Yes |
| Reflects biodiversity | Partially | Completely |
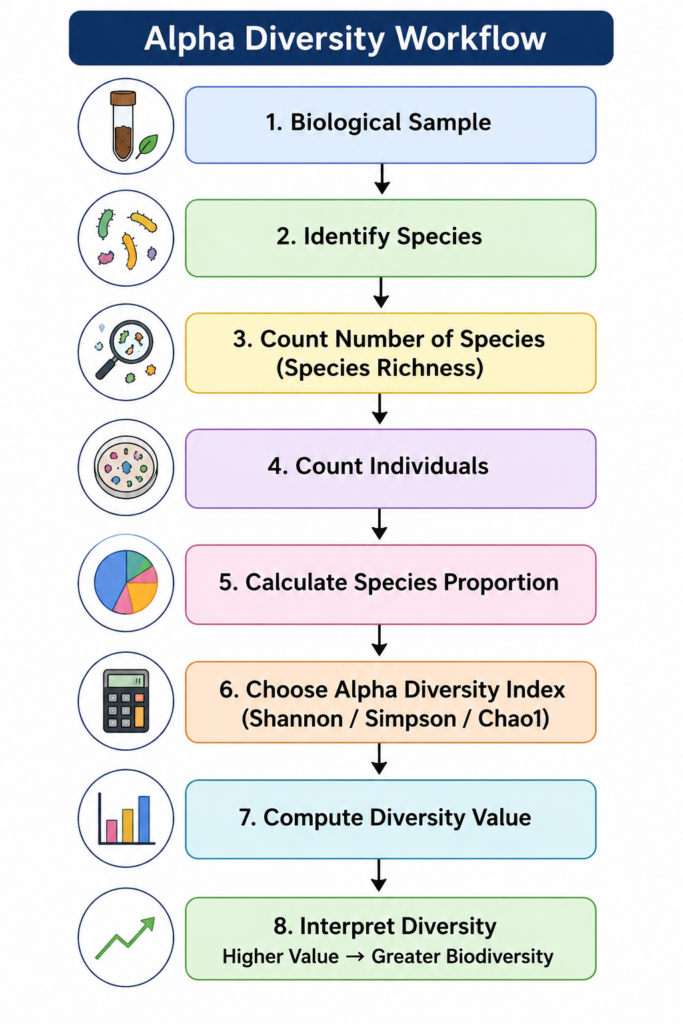
Alpha Diversity Workflow
Interpretation Guide
| Alpha Diversity Value | Interpretation |
|---|---|
| Very Low | Poor biodiversity |
| Low | Few species present |
| Moderate | Moderate diversity |
| High | Rich biological community |
| Very High | Healthy ecosystem with balanced species |
Conclusion
Alpha diversity (α-diversity) is a cornerstone metric in biostatistics, ecology, and microbiome research because it quantifies biodiversity within a single sample or habitat. By combining species richness and evenness, it provides a more complete picture of community structure than species counts alone. Common indices such as the Shannon Index, Simpson Index, and Chao1 estimator allow researchers to assess ecosystem health, compare treatment effects, monitor environmental changes, and evaluate microbial communities. Understanding alpha diversity enables scientists to make informed decisions in conservation, agriculture, environmental monitoring, and biomedical research, making it an indispensable tool in modern biological data analysis.