Introduction
In biostatistics, statistical tests are not just mathematical formulas—they are built on assumptions. One of the most important and frequently tested assumptions is homogeneity of variances, also known as homoscedasticity. This assumption states that the variability of a dependent variable should be approximately equal across different groups being compared.
In biological and medical research, researchers commonly compare groups such as treatment vs. control, male vs. female, exposed vs. unexposed, or multiple dosage levels. Tests like t-tests, ANOVA, ANCOVA, and linear regression rely heavily on the assumption that variances are equal across groups. When this assumption is violated, statistical conclusions may become misleading, leading to incorrect p-values, inflated Type I errors, or reduced statistical power.
This article provides a comprehensive explanation of homogeneity of variances in biostatistics, including its definition, importance, statistical tests, interpretation, common pitfalls, and practical examples from biological sciences. Whether you are a student, researcher, or data analyst, understanding this assumption is essential for producing valid and reproducible results.
What Is Homogeneity of Variances?
Homogeneity of variances refers to a condition where multiple groups have similar variability in their measured outcomes. In simpler terms, it means that the spread of data within each group is roughly the same.
For example, if a researcher measures blood glucose levels in three treatment groups, homogeneity of variances implies that the variability of glucose levels within each group is comparable.
Mathematically, if σ₁², σ₂², σ₃² represent the variances of three groups, homogeneity assumes:
σ₁² ≈ σ₂² ≈ σ₃²
This assumption does not require variances to be exactly equal but sufficiently similar to allow valid statistical inference.
Why Is Homogeneity of Variances Important in Biostatistics?
The importance of homogeneity of variances lies in how test statistics are calculated. Many parametric tests use a pooled variance estimate, which assumes that all groups contribute equally to the overall variability.
Key reasons this assumption matters:
- Validity of p-values
Unequal variances can distort p-values, increasing false positives or false negatives. - Accuracy of confidence intervals
Confidence intervals may become too narrow or too wide when variance assumptions are violated. - Statistical power
Heterogeneous variances can reduce the ability to detect real biological effects. - Model interpretability
Regression coefficients and group comparisons become less reliable.
In biostatistics, where decisions may influence clinical treatment, public health policies, or ecological conservation, violating assumptions can have serious consequences.
Statistical Tests That Assume Homogeneity of Variances
Homogeneity of variances is a core assumption in many commonly used biostatistical methods.
| Statistical Method | Requires Homogeneity of Variances |
|---|---|
| Independent t-test | Yes |
| One-way ANOVA | Yes |
| Two-way ANOVA | Yes |
| ANCOVA | Yes |
| Linear Regression | Yes (for residuals) |
| MANOVA | Yes |
| Repeated Measures ANOVA | Assumed across groups |
If this assumption is violated, alternative methods or corrections must be applied.
Common Tests for Homogeneity of Variances
Before conducting parametric tests, researchers should formally test whether variances are equal across groups.
1. Levene’s Test
Levene’s test is the most widely used and robust test for checking homogeneity of variances.
- Null hypothesis (H₀): Group variances are equal
- Alternative hypothesis (H₁): At least one group variance differs
Levene’s test works well even when data deviate from normality, making it highly suitable for biological data.
Interpretation:
- p > 0.05 → Homogeneity assumed
- p ≤ 0.05 → Homogeneity violated
2. Bartlett’s Test
Bartlett’s test is a classical test for equality of variances but is highly sensitive to non-normality.
- Best used when data are normally distributed
- Not recommended for skewed biological data
Interpretation is similar to Levene’s test, but caution is required in real-world datasets.
3. Brown–Forsythe Test
The Brown–Forsythe test is a modified version of Levene’s test that uses the median instead of the mean.
- More robust against outliers
- Suitable for skewed biological measurements
Comparison of Variance Homogeneity Tests
| Test Name | Robust to Non-Normality | Sensitive to Outliers | Common Usage |
|---|---|---|---|
| Levene’s Test | Yes | Moderate | Most common |
| Bartlett’s Test | No | High | Rare in biology |
| Brown–Forsythe Test | Yes | Low | Preferred for skewed data |
Graphical Methods to Assess Homogeneity
In addition to formal tests, visual inspection is strongly recommended.
Common graphical approaches include:
- Box plots: Compare spread across groups
- Residual plots: Check constant variance in regression
- Error bar plots: Observe SD or SE differences
If one group shows noticeably larger spread than others, homogeneity may be violated—even if the statistical test is non-significant.
Homogeneity of Variances in ANOVA
ANOVA compares means across multiple groups using pooled variance. When variances are unequal:
- Type I error rate increases
- F-statistic becomes unreliable
What to do if homogeneity is violated?
- Use Welch’s ANOVA
- Apply data transformation (log, square root)
- Switch to non-parametric tests (Kruskal–Wallis)
Welch’s ANOVA is particularly useful in biostatistics because it does not assume equal variances.
Homogeneity of Variances in Regression Analysis
In regression, homogeneity of variances applies to residuals, not raw data.
This is called homoscedasticity, meaning residuals have constant variance across predicted values.
Consequences of heteroscedasticity:
- Biased standard errors
- Invalid hypothesis tests
- Misleading confidence intervals
Residual plots are the most effective way to assess this assumption.
Biological and Medical Examples
Example 1: Clinical Trial Data
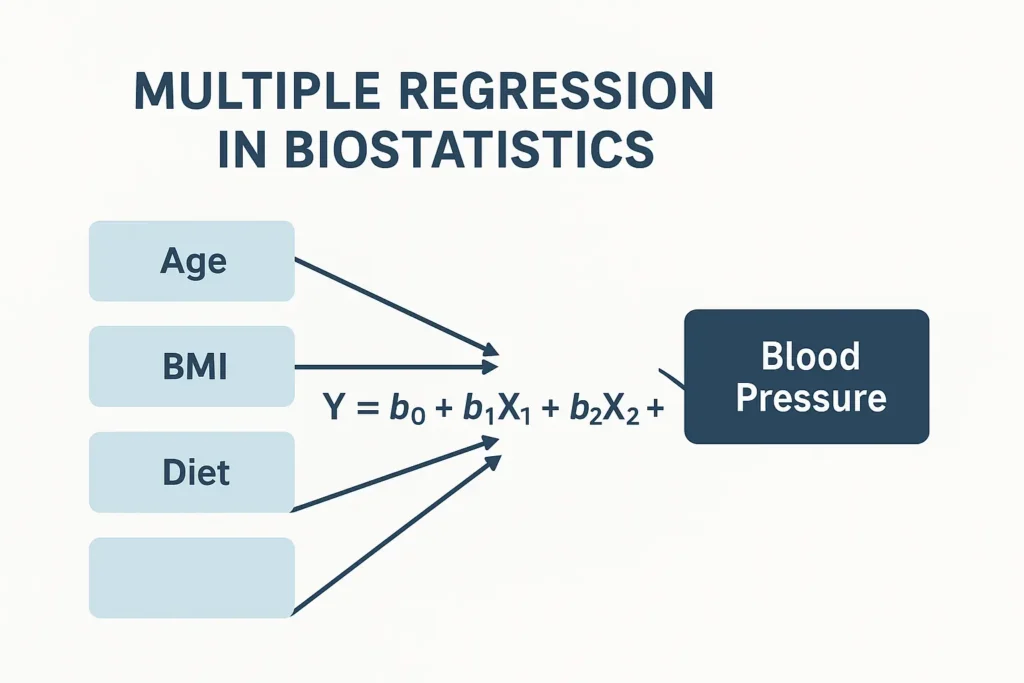
A researcher compares blood pressure across three drug doses. If variability increases with dosage, homogeneity is violated, and standard ANOVA may overestimate significance.
Example 2: Ecological Studies
Species abundance data often show high variance in disturbed habitats. Testing homogeneity helps decide between ANOVA and non-parametric alternatives.
Example 3: Laboratory Experiments
Enzyme activity measurements across temperature levels may show unequal variability due to biological instability at higher temperatures.
How to Handle Violation of Homogeneity
When homogeneity of variances is violated, researchers have several options:
- Use robust tests (Welch’s t-test, Welch’s ANOVA)
- Transform data (log, square root, Box-Cox)
- Apply non-parametric methods
- Use generalized linear models (GLMs)
Choosing the correct approach depends on study design, sample size, and research objectives.
Common Mistakes in Practice
- Ignoring variance tests entirely
- Relying only on p-values without visual inspection
- Using Bartlett’s test on non-normal data
- Automatically transforming data without justification
Good biostatistical practice requires both statistical testing and biological reasoning.
Conclusion
Homogeneity of variances is a fundamental assumption in biostatistics that directly affects the validity of many commonly used statistical tests. In biological and medical research, where data often show natural variability, checking this assumption is not optional—it is essential.
By understanding the concept of homogeneity, applying appropriate statistical tests such as Levene’s test, using graphical diagnostics, and choosing suitable alternatives when violations occur, researchers can ensure their analyses are accurate, reliable, and scientifically defensible.
Whether you are performing ANOVA, regression, or comparative studies, always remember: equal variances support valid conclusions, but unequal variances demand careful solutions.