
Introduction
In biomedical and biological research, comparing two groups is one of the most common analytical tasks. Before applying parametric tests such as the independent samples t-test, researchers must ensure that key assumptions are satisfied. One of the most important assumptions is homogeneity of variances, meaning that the variability in the two groups is approximately equal.
The Variance Ratio Test, commonly known as the F-Test, is specifically designed to compare the variances of two independent samples. In medical research, this test is frequently applied to physiological measurements such as blood pressure, cholesterol levels, glucose concentrations, and other clinical indicators.
This article provides a of the Variance Ratio Test (F-Test) in MedCalc, using an example dataset comparing male and female systolic blood pressure (SBP). The article also explains how to interpret the MedCalc output and how to integrate a box plot visualization into your results section.
What Is the Variance Ratio Test (F-Test)?
The Variance Ratio Test evaluates whether two populations have equal variances. It does this by calculating the ratio of the larger sample variance to the smaller sample variance.
Mathematically:
F = Variance of Sample 1 / Variance of Sample 2
If the variances are similar, the F-value will be close to 1. A large deviation from 1 suggests unequal variances.
Why Is the F-Test Important in Biostatistics?
In biostatistics, many commonly used tests (such as the independent samples t-test) assume equal variances between groups. If this assumption is violated:
- Statistical conclusions may be invalid
- Type I or Type II error rates may increase
- Alternative tests (e.g., Welch’s t-test or nonparametric tests) may be required
Therefore, the F-Test is often used as a preliminary diagnostic test before comparing group means.
Example Dataset: Systolic Blood Pressure
In this example, systolic blood pressure (mmHg) values are compared between two independent groups:
- Group 1: Male systolic blood pressure
- Group 2: Female systolic blood pressure
Each group contains 10 observations.
Download the Dataset
How to Perform the Variance Ratio Test in MedCalc
Step 1: Enter the Data
- Open MedCalc
- Enter male SBP values in one column
- Enter female SBP values in another column
Step 2: Navigate to the Test
- Click Statistics → Comparison of samples → Variance ratio test (F-test)
Step 3: Select Variables
- Sample 1: M_Systolic_BP_mmHg
- Sample 2: F_Systolic_BP_mmHg
Step 4: Run the Analysis
MedCalc will automatically compute descriptive statistics and the F-test result.
MedCalc Output Explained
Descriptive Statistics
| Parameter | Male SBP | Female SBP |
|---|---|---|
| Sample size (n) | 10 | 10 |
| Mean (mmHg) | 132.6 | 124.9 |
| Standard Deviation | 3.20 | 2.60 |
| Variance | 10.27 | 6.77 |
| 95% CI for Mean | 130.31 – 134.89 | 123.04 – 126.76 |
These descriptive values provide an overview of central tendency and variability before formal hypothesis testing.
Variance Ratio Test (F-Test) Results
| Statistic | Value |
| Variance ratio (F) | 1.517 |
| Significance level (p-value) | 0.544 |
Interpretation of Results
The F-value of 1.517 indicates that the variance in male systolic blood pressure is approximately 1.5 times that of female systolic blood pressure. However, the p-value (0.544) is much greater than the conventional significance threshold of 0.05.
Statistical Conclusion
- Fail to reject the null hypothesis
- There is no statistically significant difference between the variances of male and female systolic blood pressure
Practical Implication
Because the assumption of equal variances is satisfied, researchers can confidently proceed with:
- Independent samples t-test (assuming equal variances)
- Parametric comparisons of group means
Box Plot Visualization
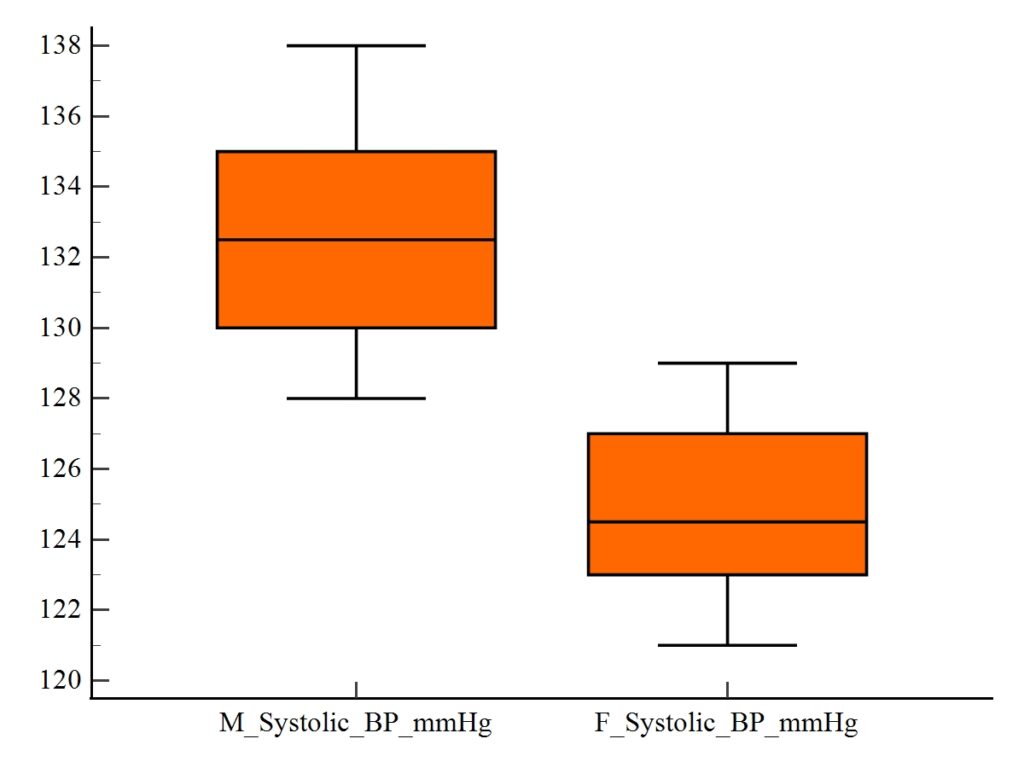
The box plot visually summarizes:
- Median systolic blood pressure
- Interquartile range (IQR)
- Minimum and maximum values
In this example:
- Male SBP shows slightly higher variability
- Female SBP distribution appears more compact
The box plot supports the numerical findings of the F-test.
When Should You Use the Variance Ratio Test?
Use the F-Test when:
- Comparing variances of two independent groups
- Data are approximately normally distributed
- Sample sizes are relatively small or moderate
Avoid the F-Test when:
- Data are strongly non-normal
- Outliers are present
- Sample sizes are extremely unequal
Common Mistakes to Avoid
- Using the F-Test without checking normality
- Interpreting variance differences as mean differences
- Ignoring graphical tools such as box plots
Reporting the F-Test in a Research Paper
Example statement:
Variance homogeneity was assessed using the variance ratio test. The variances of male and female systolic blood pressure did not differ significantly (F = 1.52, p = 0.544), indicating that the assumption of equal variances was satisfied.
Conclusion
The Variance Ratio Test (F-Test) is a fundamental tool in biostatistics for assessing equality of variances between two independent groups. Using MedCalc, researchers can quickly perform this test and obtain clear, interpretable results.
In this example comparing male and female systolic blood pressure, the F-Test confirmed that the variances were statistically similar. Combined with box plot visualization, the analysis provides both numerical and graphical confirmation of variance homogeneity.
Understanding and correctly applying the F-Test ensures valid downstream analyses and strengthens the statistical rigor of biomedical research.


