
Introduction
Meta-analysis is an advanced statistical technique used to combine results from multiple independent studies. When studies compare event rates between treatment and control groups, researchers commonly use Relative Risk (RR) as the effect measure.
Meta-Analysis Relative Risk is widely applied in clinical trials, epidemiology, public health research, pharmaceutical studies, and evidence-based medicine. It helps determine whether an intervention reduces or increases the risk of an outcome compared with a control group.
In this tutorial, we explain how to perform Meta-Analysis Relative Risk in MedCalc, interpret the software output, understand forest and funnel plots, evaluate heterogeneity, assess publication bias, and report results correctly using the output and graphs provided.
What is Relative Risk?
Relative Risk (Risk Ratio) compares the probability of an event occurring in the treatment group with the probability of the same event occurring in the control group.
The formula is:
Interpretation of Relative Risk
| Relative Risk | Interpretation |
|---|---|
| RR = 1 | No difference between groups |
| RR > 1 | Increased risk in treatment group |
| RR < 1 | Reduced risk in treatment group |
| RR = 0.50 | Risk reduced by 50% |
| RR = 2.00 | Risk doubled |
Biomedical Example
Suppose researchers want to evaluate whether a new antihypertensive drug reduces hypertension compared with placebo.
Each study reports:
- Total patients in treatment group
- Positive outcomes in treatment group
- Total patients in control group
- Positive outcomes in control group
These studies are then combined through meta-analysis.
Example Dataset
| Study | Treat_Total | Treat_Positive | Control_Total | Control_Positive |
|---|---|---|---|---|
| Study 1 | 200 | 30 | 200 | 60 |
| Study 2 | 180 | 28 | 180 | 52 |
| Study 3 | 250 | 40 | 250 | 78 |
| Study 4 | 220 | 35 | 220 | 65 |
| Study 5 | 300 | 48 | 300 | 92 |
| Study 6 | 280 | 42 | 280 | 85 |
| Study 7 | 240 | 36 | 240 | 70 |
| Study 8 | 260 | 39 | 260 | 75 |
📥 Download Dataset
Download the Excel dataset used in this tutorial:
Manual Relative Risk Calculation
Using Study 1:
Treatment Risk
30 ÷ 200 = 0.15
Control Risk
60 ÷ 200 = 0.30
Relative Risk
0.15 ÷ 0.30 = 0.50
Interpretation
RR = 0.50
This means the treatment reduced the risk of hypertension by approximately 50% compared with the control group.
Step-by-Step Meta-Analysis Relative Risk in MedCalc
Step 1
Open MedCalc.
Go to:
Statistics → Meta-analysis → Relative Risk
Step 2
Select:
Studies
Study
Intervention Group
Total Cases → Treat_Total
Positive Outcomes → Treat_Positive
Control Group
Total Cases → Control_Total
Positive Outcomes → Control_Positive
Step 3
Configure the options.
Step 4
Click OK.
MedCalc generates:
- Forest Plot
- Funnel Plot
- Relative Risk Estimate
- Heterogeneity Statistics
- Publication Bias Tests
MedCalc Options Explanation
Forest Plot
Displays:
- Individual study effects
- Confidence intervals
- Overall pooled relative risk
Recommended:
✔ Enabled
Marker Size Relative to Study Weight
Determines the square size in the forest plot.
Larger studies receive larger weights.
Fixed Effect Model Weights
Assumes all studies estimate the same true effect.
Appropriate when heterogeneity is minimal.
Random Effect Model Weights
Assumes study effects vary.
Recommended for most biomedical research.
✔ Enabled
Plot Pooled Effect – Fixed Effects
Displays pooled relative risk using fixed effect assumptions.
Optional.
Plot Pooled Effect – Random Effects
Displays pooled relative risk using random effect assumptions.
✔ Recommended
Diamonds for Pooled Effects
Shows the pooled estimate as a diamond.
The width of the diamond represents the confidence interval.
✔ Recommended
Funnel Plot
Used to evaluate publication bias.
✔ Recommended
Relative Risk Results
The analysis included:
- 8 studies
- 1,930 participants in treatment groups
- 1,930 participants in control groups
Individual Study Results
| Study | Relative Risk | 95% CI |
|---|---|---|
| Study 1 | 0.500 | 0.338–0.740 |
| Study 2 | 0.538 | 0.357–0.812 |
| Study 3 | 0.513 | 0.366–0.719 |
| Study 4 | 0.538 | 0.373–0.776 |
| Study 5 | 0.522 | 0.383–0.711 |
| Study 6 | 0.494 | 0.355–0.688 |
| Study 7 | 0.514 | 0.359–0.737 |
| Study 8 | 0.520 | 0.368–0.735 |
Overall Pooled Relative Risk
Fixed Effects Model
RR = 0.516
95% CI = 0.456–0.585
P < 0.001
Random Effects Model
RR = 0.517
95% CI = 0.456–0.585
P < 0.001
Interpretation of Pooled RR
The pooled Relative Risk is approximately 0.52.
This means:
👉 Patients receiving treatment experienced about 48% lower risk compared with the control group.
Because:
- RR < 1
- P < 0.001
The treatment effect is statistically significant.
Forest Plot Interpretation
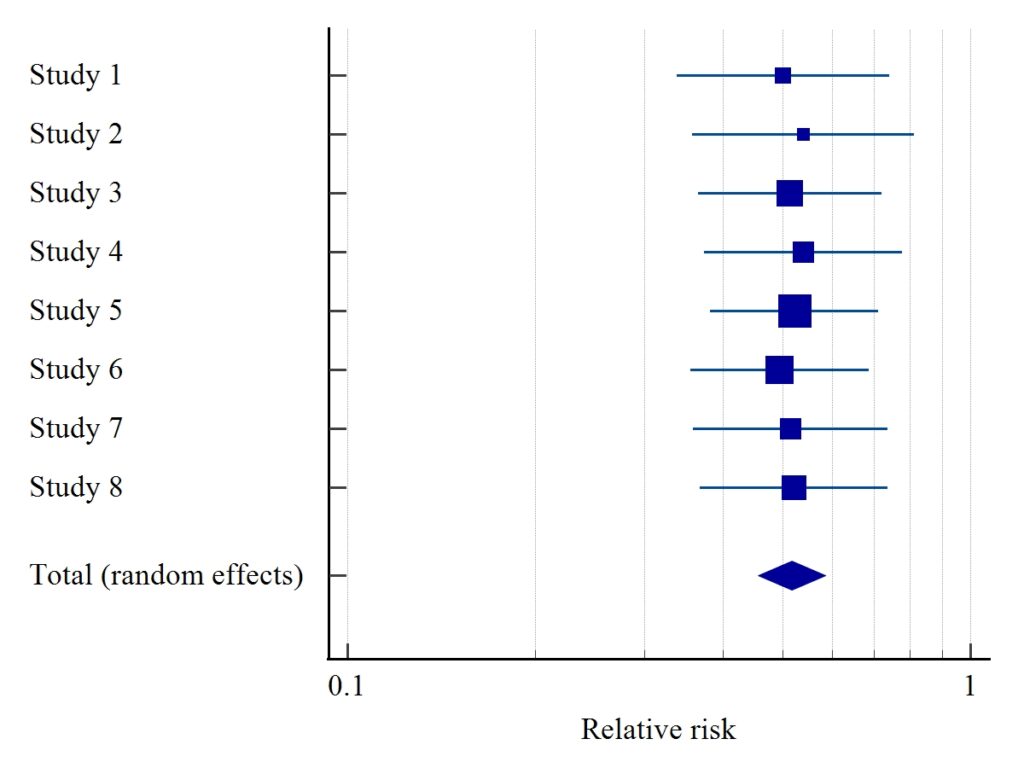
Squares
Represent study-specific relative risks.
Horizontal Lines
Represent 95% confidence intervals.
Diamond
Represents the pooled relative risk estimate.
Interpretation
Most study estimates cluster around RR = 0.50.
The pooled diamond is centered near 0.52.
Because the confidence interval does not cross RR = 1, the overall treatment effect is statistically significant.
Test for Heterogeneity
The MedCalc output reported:
- Q = 0.1925
- DF = 7
- P = 1.0000
- I² = 0.00%
Heterogeneity Interpretation
Q Test
P = 1.0000
Since P > 0.05:
✔ No significant heterogeneity
I² Statistic
I² = 0%
Interpretation:
- 0–25% = Low heterogeneity
- 25–50% = Moderate heterogeneity
- 50–75% = High heterogeneity
- 75% = Very high heterogeneity
Result:
✔ Studies are highly consistent.
Funnel Plot Interpretation
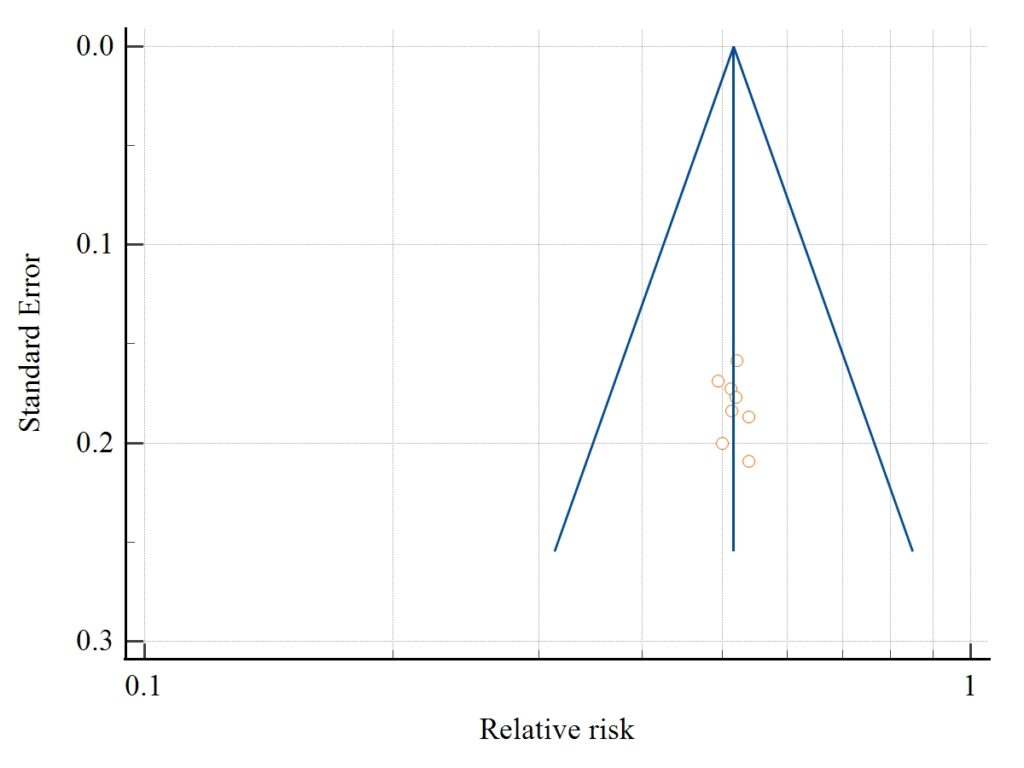
The funnel plot assesses publication bias.
The studies appear symmetrically distributed around the pooled estimate.
This suggests minimal evidence of publication bias.
Publication Bias Results
Egger’s Test
Intercept = 0.5148
95% CI = -1.2493 to 2.2789
P = 0.5020
Begg’s Test
Kendall’s Tau = 0.2143
P = 0.4579
Interpretation of Publication Bias
Both tests are non-significant:
- Egger’s Test P > 0.05
- Begg’s Test P > 0.05
Therefore:
✔ No significant publication bias detected.
Advantages of Relative Risk Meta-Analysis
✔ Combines multiple studies
✔ Improves statistical power
✔ Produces reliable effect estimates
✔ Supports evidence-based medicine
✔ Facilitates clinical decision-making
Applications in Biomedical Research
Relative Risk Meta-Analysis is widely used for:
- Drug efficacy studies
- Vaccine effectiveness studies
- Clinical trials
- Epidemiological investigations
- Public health interventions
- Disease prevention programs
Conclusion
Meta-Analysis Relative Risk in MedCalc is a powerful technique for combining treatment and control outcomes across multiple studies. In this example, eight studies were analyzed and the pooled relative risk was approximately 0.52, indicating a substantial reduction in risk among treated participants. The forest plot demonstrated consistent effects across studies, while heterogeneity analysis showed I² = 0%, indicating excellent consistency. Publication bias assessments using Egger’s and Begg’s tests were non-significant, suggesting reliable and unbiased results. These findings highlight the importance of Relative Risk Meta-Analysis in clinical research, epidemiology, and evidence-based healthcare.


