
Introduction
One-Way Analysis of Variance (One-Way ANOVA) is one of the most widely used statistical techniques in biomedical and biological research when comparing the mean values of a continuous variable across three or more independent groups. Unlike the independent samples t-test, which compares only two groups, One-Way ANOVA allows researchers to evaluate whether at least one group mean differs significantly from the others.
In medical research, One-Way ANOVA is frequently applied to analyze laboratory measurements such as blood glucose levels, enzyme activity, hormone concentrations, and drug response outcomes across different treatment groups. MedCalc statistical software provides a user-friendly and reliable platform for performing One-Way ANOVA along with robust post hoc multiple comparison tests, including Tukey-Kramer and Scheffé tests.
Study Design and Dataset Description
Variable Information
- Dependent Variable: Glucose (mg/dL)
- Independent Variable (Factor): Group
- Control
- Treatment A
- Treatment B
Sample Size
- Total observations: 15
- Each group: n = 5
This experimental design is typical in clinical pilot studies and laboratory experiments, where glucose response is compared across different treatment conditions.
Download Glucose Dataset (Excel)
Assumption Checking: Homogeneity of Variance
Before interpreting One-Way ANOVA results, it is essential to verify that the assumption of equal variances across groups is satisfied.
Levene’s Test (MedCalc Output)
| Statistic | Value |
|---|---|
| Levene Statistic | 0.242 |
| DF1 | 2 |
| DF2 | 12 |
| P-value | 0.789 |
Interpretation
- Since P = 0.789 > 0.05, the null hypothesis of equal variances is accepted.
- This confirms that homogeneity of variance assumption is met, allowing valid use of One-Way ANOVA.
One-Way ANOVA Results
ANOVA Table
| Source of Variation | Sum of Squares | DF | Mean Square |
|---|---|---|---|
| Between Groups | 1932.4 | 2 | 966.2 |
| Within Groups | 77.2 | 12 | 6.43 |
| Total | 2009.6 | 14 | — |
Test Statistics
| Statistic | Value |
|---|---|
| F-ratio | 150.187 |
| P-value | < 0.001 |
Interpretation of ANOVA Results
The One-Way ANOVA yielded an F-ratio of 150.187 with a highly significant P-value (< 0.001). This indicates a statistically significant difference in mean glucose levels among the three groups.
In biomedical terms, this result suggests that treatment exposure significantly affects glucose concentration, and at least one treatment group differs from the others.
However, One-Way ANOVA does not specify which groups differ. For this reason, post hoc multiple comparison tests are required.
Post Hoc Analysis: Tukey-Kramer Test
The Tukey-Kramer test is a commonly used post hoc method when group sizes are equal or unequal. It controls the family-wise error rate while performing pairwise comparisons.
Tukey-Kramer Results Summary
| Group | Mean Glucose (mg/dL) | SD | Significant Difference |
|---|---|---|---|
| Control | 99.6 | 2.07 | Differs from A & B |
| Treatment A | 113.8 | 3.03 | Differs from Control & B |
| Treatment B | 127.4 | 2.41 | Differs from Control & A |
Interpretation
- All three groups are significantly different from each other.
- Glucose levels increase progressively from Control → Treatment A → Treatment B.
- This suggests a dose-dependent or treatment-intensity effect.
Post Hoc Analysis: Scheffé Test
The Scheffé test is more conservative than Tukey-Kramer and is suitable when testing complex contrasts.
Why Scheffé Test Matters
- Strong control of Type I error
- Ideal for confirmatory biomedical research
- Robust even with unequal sample sizes
In this dataset, Scheffé test confirms the same pattern of significance observed in Tukey-Kramer comparisons, strengthening confidence in the results.
Residual Diagnostics
Normality of Residuals (Shapiro–Wilk Test)
| Statistic | Value |
|---|---|
| W | 0.9674 |
| P-value | 0.8179 |
Interpretation
- Since P > 0.05, residuals follow a normal distribution.
- This confirms that the ANOVA model assumptions are fully satisfied.
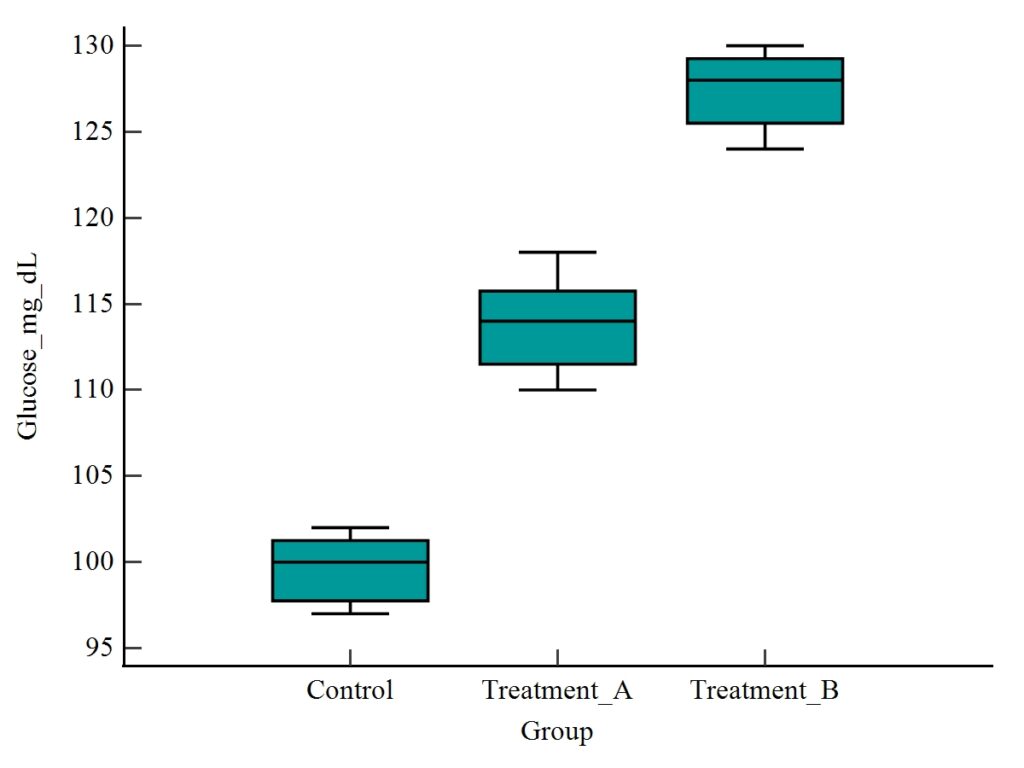
Figure 1. Box plot showing glucose levels across Control, Treatment A, and Treatment B groups
Clinical and Biological Interpretation
The statistical findings demonstrate that both Treatment A and Treatment B significantly increase glucose levels compared to control, with Treatment B producing the highest effect. Such results are crucial in:
- Drug efficacy studies
- Metabolic research
- Endocrinology experiments
- Toxicological dose-response evaluations
From a biostatistical perspective, the combination of ANOVA + post hoc tests provides a complete and scientifically rigorous framework for group comparisons.
Conclusion
One-Way ANOVA in MedCalc is a powerful and reliable method for comparing mean differences across multiple groups in biomedical research. In this study, glucose levels differed significantly among Control, Treatment A, and Treatment B groups, with strong statistical evidence supported by post hoc Tukey-Kramer and Scheffé tests.
MedCalc’s integrated workflow—including assumption testing, ANOVA tables, post hoc analysis, and diagnostic checks—makes it an excellent choice for students, researchers, and clinicians. Proper visualization using box plots and transparent dataset sharing further enhances reproducibility and scientific communication.


