Introduction
In statistical analysis, understanding the nature of variables is fundamental to choosing the correct analytical method and interpreting results accurately. Among different types of variables, the continuous dependent variable plays a central role in many scientific, medical, biological, economic, and social science studies. From measuring blood pressure and enzyme activity to recording income levels or growth rates, continuous dependent variables allow researchers to quantify outcomes with precision and explore subtle variations in data.
This article provides a comprehensive explanation of what a continuous dependent variable is, its characteristics, common examples, statistical models used to analyze it, assumptions involved, and practical applications in research.
What Is a Dependent Variable?
A dependent variable is the outcome or response variable that a researcher aims to explain or predict. Its value depends on one or more independent variables (also called predictors or explanatory variables). In experimental studies, the dependent variable is measured to observe the effect of controlled changes in independent variables. In observational studies, it reflects natural variation influenced by multiple factors.
For example:
- Fertilizer dose → Plant height (dependent variable)
- Drug treatment → Blood glucose level
- Study hours → Exam score
Definition of a Continuous Dependent Variable
A continuous dependent variable is a quantitative outcome variable that can take any numerical value within a specified range, including decimals and fractions. Unlike categorical or discrete variables, continuous variables are measured rather than counted.
Key Definition
A continuous dependent variable is a numerical outcome variable that can assume an infinite number of values within a given interval and is typically measured on an interval or ratio scale.
Characteristics of Continuous Dependent Variables
Continuous dependent variables have several defining characteristics:
- Infinite possible values
Values can lie anywhere between two numbers (e.g., 2.3, 2.35, 2.351). - Measured, not counted
They are obtained using measuring instruments such as rulers, balances, thermometers, or laboratory equipment. - Numeric with meaningful magnitude
Differences between values are meaningful (e.g., the difference between 10 and 20 is the same as between 30 and 40). - Usually interval or ratio scale
- Interval scale: Equal intervals, no true zero (e.g., temperature in °C)
- Ratio scale: Equal intervals with a true zero (e.g., weight, length)
Examples of Continuous Dependent Variables
Continuous dependent variables are widely used across disciplines:
Biological and Medical Sciences
- Blood pressure (mmHg)
- Cholesterol level (mg/dL)
- Enzyme activity rate
- Body mass index (BMI)
- Oxygen consumption (VO₂ max)
Environmental and Agricultural Studies
- Crop yield (kg/ha)
- Soil moisture content (%)
- Rainfall (mm)
- Plant height (cm)
Social and Economic Research
- Income level
- Time spent on an activity (hours)
- Test scores
- Reaction time (milliseconds)
Continuous vs Discrete Dependent Variables
| Feature | Continuous | Discrete |
|---|---|---|
| Possible values | Infinite | Finite or countable |
| Measurement | Measured | Counted |
| Examples | Height, weight | Number of children, defects |
| Typical analysis | Regression, ANOVA | Poisson, logistic models |
Understanding this distinction is essential when selecting statistical tests.
Statistical Methods Used with Continuous Dependent Variables
Several statistical techniques are specifically designed for continuous dependent variables.
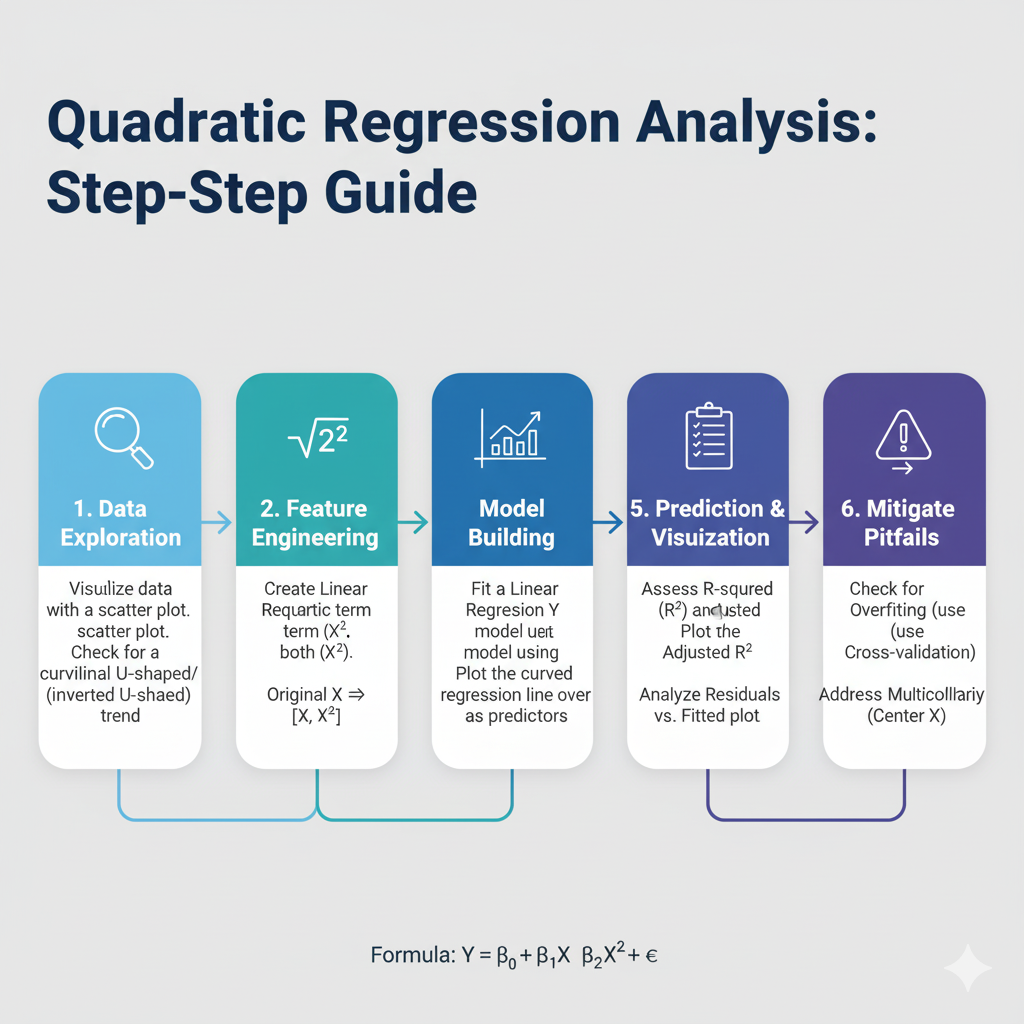
1. Linear Regression
Linear regression models the relationship between a continuous dependent variable and one or more independent variables.
Example:
- Dependent variable: Blood pressure
- Independent variables: Age, BMI, physical activity
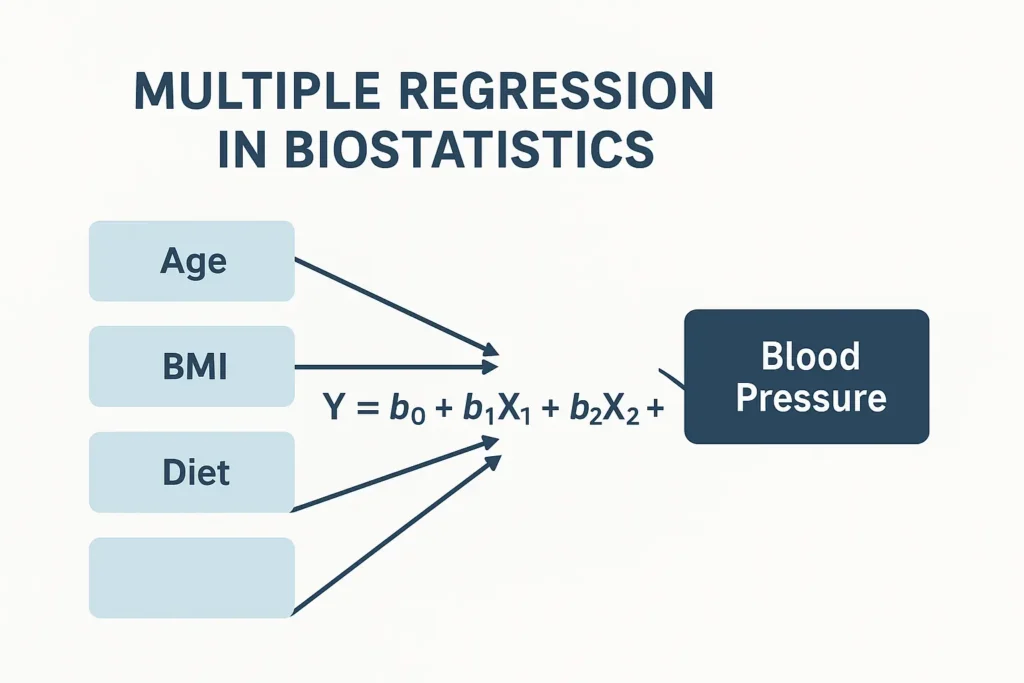
2. Multiple Linear Regression
Used when more than one predictor influences the continuous outcome.
3. Analysis of Variance (ANOVA)
ANOVA compares mean values of a continuous dependent variable across two or more categorical groups.
Example:
- Dependent variable: Plant growth
- Independent variable: Fertilizer type
4. ANCOVA (Analysis of Covariance)
ANCOVA combines regression and ANOVA by including both categorical and continuous predictors.
5. Linear Mixed Effects Models
Used when data involve repeated measures or hierarchical structures (e.g., measurements nested within subjects or plots).
Assumptions When Analyzing Continuous Dependent Variables
Most parametric methods involving continuous dependent variables require certain assumptions:
- Normality
The dependent variable (or model residuals) should be approximately normally distributed. - Linearity
There should be a linear relationship between dependent and independent variables. - Homoscedasticity
Variance of residuals should be constant across levels of predictors. - Independence
Observations should be independent unless modeled otherwise (e.g., mixed models).
Violations of these assumptions may require data transformation or alternative non-parametric methods.
Data Visualization for Continuous Dependent Variables
Visual representation is essential for understanding patterns and distributions.
Common plots include:
- Histogram – distribution of values
- Box plot – median, quartiles, outliers
- Scatter plot – relationship with predictors
- Line graph – trends over time
These visual tools help detect outliers, skewness, and potential model violations.
Importance in Research and Decision-Making
Continuous dependent variables provide high-resolution information, allowing researchers to:
- Detect small but meaningful effects
- Quantify dose–response relationships
- Build predictive models
- Support evidence-based decision-making
In fields like medicine and ecology, even minor changes in continuous outcomes can have significant real-world implications.
Common Mistakes to Avoid
- Treating a continuous variable as categorical without justification
- Ignoring assumption checks
- Overinterpreting statistical significance without effect size
- Using inappropriate models for the data structure
Careful planning and analysis ensure valid and reliable conclusions.
Conclusion
A continuous dependent variable is a cornerstone of quantitative research, enabling precise measurement and sophisticated statistical analysis. Its ability to capture subtle variations makes it indispensable in biology, medicine, agriculture, economics, and social sciences. By understanding its characteristics, appropriate analytical methods, and underlying assumptions, researchers can draw meaningful insights and improve the quality of their scientific conclusions.
Whether analyzing plant growth, physiological responses, or economic indicators, correctly handling continuous dependent variables leads to more accurate models, clearer interpretations, and stronger evidence in research.