
Introduction
In biomedical and clinical research, comparing the mean values of a continuous variable between two independent groups is a common analytical task. Examples include comparing blood pressure between males and females, treatment vs control groups, or exposed vs unexposed populations. One of the most widely used statistical methods for this purpose is the Independent Samples t-test.
The independent samples t-test evaluates whether the difference between two group means is statistically significant, assuming that observations in one group are independent of observations in the other. MedCalc statistical software provides a clear and user-friendly interface for performing this test, including assumption checking, effect estimation, confidence intervals, and graphical outputs.
About the Dataset
The analysis compares systolic blood pressure (mmHg) between two independent groups:
- Sample 1: Male Systolic Blood Pressure
- Sample 2: Female Systolic Blood Pressure
Each group consists of 12 independent observations. Systolic blood pressure is a continuous variable measured in millimeters of mercury (mmHg) and is commonly used as a key indicator of cardiovascular health.
Why Use an Independent Samples t-Test?
The independent samples t-test is appropriate when:
- The dependent variable is continuous
- The independent variable has two unrelated groups
- Observations are independent
- Data are approximately normally distributed
- Variances between groups are equal or nearly equal
MedCalc automatically checks several of these assumptions, making it suitable for medical and biostatistical applications.
Descriptive Statistics from MedCalc Output
Before interpreting the t-test results, it is essential to examine descriptive statistics.
Table 1. Descriptive Statistics for Systolic Blood Pressure
| Statistic | Males (n = 12) | Females (n = 12) |
|---|---|---|
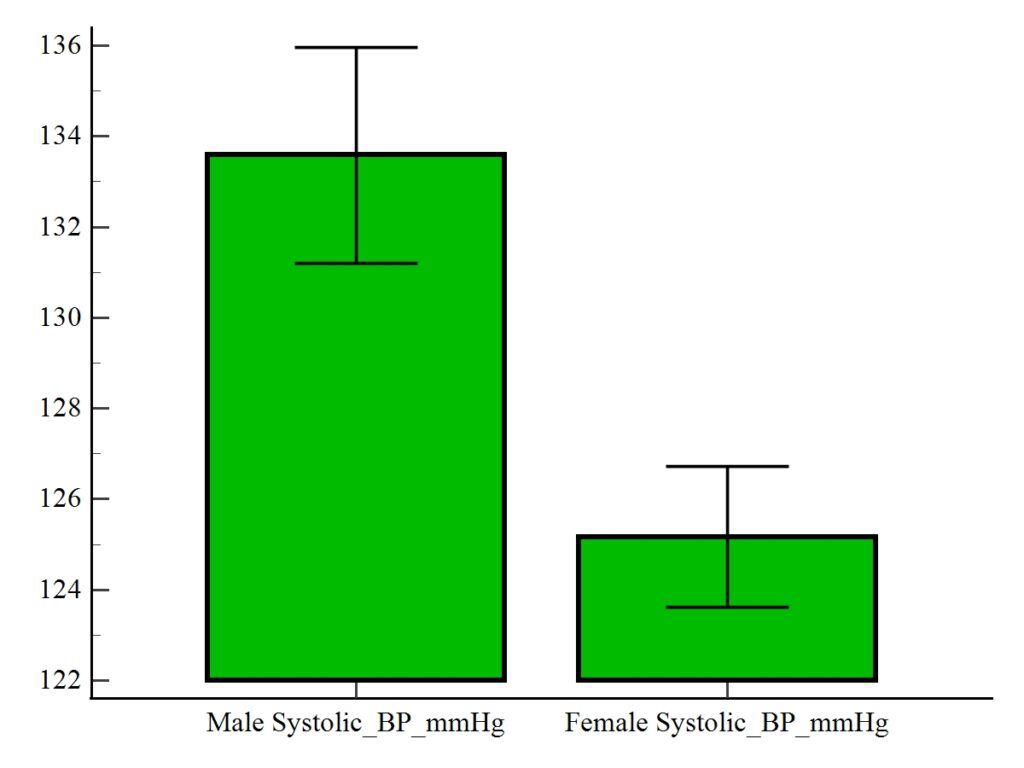
| Mean (mmHg) | 133.5833 | 125.1667 |
| 95% CI for Mean | 131.1989 to 135.9677 | 123.6143 to 126.7191 |
| Variance | 14.0833 | 5.9697 |
| Standard Deviation | 3.7528 | 2.4433 |
| Standard Error | 1.0833 | 0.7053 |
Interpretation
- The mean systolic blood pressure is higher in males than females.
- Male participants show greater variability in systolic BP compared to females.
- The 95% confidence intervals do not overlap substantially, suggesting a meaningful difference.
Testing Assumption of Equal Variances (F-test)
Before performing the t-test, MedCalc conducts an F-test for equality of variances.
F-test Result
- P = 0.170
Interpretation
Since P > 0.05, we fail to reject the null hypothesis of equal variances. Therefore:
✔ The assumption of equal variances is satisfied
✔ It is appropriate to use the t-test assuming equal variances
This justifies the use of pooled standard deviation in the t-test calculation.
Independent Samples t-Test Results (Equal Variances Assumed)
Table 2. Independent Samples t-Test Results
| Statistic | Value |
|---|---|
| Mean Difference (Male − Female) | −8.4167 |
| Pooled Standard Deviation | 3.1665 |
| Standard Error of Difference | 1.2927 |
| 95% CI of Difference | −11.0976 to −5.7358 |
| t Statistic | −6.511 |
| Degrees of Freedom (DF) | 22 |
| Two-tailed P-value | P < 0.0001 |
Interpretation of the t-Test Results
1. Mean Difference
The mean systolic blood pressure of males is 8.42 mmHg higher than that of females.
This difference is clinically relevant and statistically large.
2. Test Statistic (t)
The calculated t-value is:
A large absolute t-value indicates that the observed difference is far from what would be expected by chance alone.
3. Degrees of Freedom
Degrees of freedom are calculated as:
This is consistent with an independent samples t-test with equal variances.
4. P-value
The two-tailed probability is:
This means:
✔ The probability that this difference occurred by random chance is less than 0.01%
✔ The result is highly statistically significant
5. Confidence Interval
The 95% confidence interval for the mean difference ranges from:
This interval does not include zero, confirming statistical significance.
Normality Check (Shapiro–Wilk Test)
MedCalc also tests whether the data follow a normal distribution.
Shapiro–Wilk Test Result
- W = 0.9880
- P = 0.9892
Interpretation
Since P > 0.05, the assumption of normality is accepted.
✔ This validates the use of the parametric t-test
✔ No data transformation is required
Clinical and Biological Interpretation
From a biomedical perspective:
- Males exhibit significantly higher systolic blood pressure than females.
- This difference may reflect:
- Hormonal influences
- Differences in vascular physiology
- Lifestyle or genetic factors
Such findings are consistent with many epidemiological studies reporting sex-based differences in cardiovascular risk profiles.
Advantages of Using MedCalc for t-Tests
MedCalc simplifies independent samples t-test analysis by providing:
- Automatic assumption checking
- Clear confidence intervals
- Effect size-related statistics
- Publication-ready tables
- Graphical comparison tools
This makes MedCalc particularly useful for medical students, clinicians, and biostatisticians.
Conclusion
The Independent Samples t-test performed in MedCalc demonstrates a highly significant difference in systolic blood pressure between male and female participants. All assumptions for parametric testing—including normality and homogeneity of variances—were satisfied, validating the use of the standard t-test.
The analysis revealed that males have a significantly higher mean systolic blood pressure than females, with a mean difference of approximately 8.4 mmHg. This result is both statistically robust and clinically meaningful.
This article provides a complete example of how to interpret and report an Independent Samples t-test using MedCalc, making it suitable for academic writing, thesis preparation, and WordPress educational content in biostatistics.


