
Introduction
In medical and clinical research, investigators frequently measure the same variable in the same individuals before and after an intervention. Typical examples include blood pressure before and after antihypertensive therapy, cholesterol levels before and after dietary intervention, or biomarker concentrations before and after treatment. The central question in such studies is whether the intervention produced a statistically significant change.
When the data follow a normal distribution, the paired samples t-test is commonly used. However, in many real-world medical datasets, the assumption of normality is violated. In these cases, a non-parametric alternative is required. The Wilcoxon signed-rank test is one of the most widely accepted non-parametric methods for analyzing paired or matched data.
This article presents a detailed explanation of the Wilcoxon signed-rank test using MedCalc software, applied to a dataset comparing systolic blood pressure (SBP) before and after treatment. The article covers:
- Concept and assumptions of the Wilcoxon signed-rank test
- When and why to use it instead of a paired t-test
- Interpretation of MedCalc output
- Presentation of results using tables and dot-and-line charts
- Scientific reporting and conclusion
This guide is especially useful for biostatistics students, medical researchers, clinical scientists, and MedCalc users.
Why Use the Wilcoxon Signed-Rank Test?
The Wilcoxon signed-rank test is a non-parametric test for paired data. It evaluates whether the median difference between paired observations is zero.
Situations Where the Wilcoxon Test Is Appropriate
- The same subjects are measured twice (before–after design)
- The dependent variable is continuous or ordinal
- The differences between paired observations are not normally distributed
- Sample size is small or moderate
- Outliers are present
Typical Applications
- Blood pressure before and after medication
- Clinical laboratory values pre- and post-treatment
- Psychological test scores before and after intervention
- Physiological measurements under two conditions
In your dataset, systolic blood pressure values before and after treatment do not satisfy the normality assumption, making the Wilcoxon signed-rank test the correct choice.
Difference Between Paired t-Test and Wilcoxon Signed-Rank Test
| Feature | Paired t-Test | Wilcoxon Signed-Rank Test |
|---|---|---|
| Data distribution | Normal | Non-normal |
| Statistic | Mean difference | Median difference |
| Sensitivity to outliers | High | Low |
| Data type | Continuous | Continuous or ordinal |
| Robustness | Moderate | High |
The Wilcoxon test is more robust when data are skewed or contain outliers.
Description of the Dataset
The dataset consists of paired systolic blood pressure measurements collected from the same individuals:
- SBP_Before_mmHg – Systolic blood pressure before treatment
- SBP_After_mmHg – Systolic blood pressure after treatment
Study Design
- Within-subject (paired) design
- Each subject contributes two measurements
- Measurements are expressed in mmHg
This design allows direct comparison of the treatment effect within each individual.
📥 Download Wilcoxon Signed-Rank Test Dataset (Excel)
Exploratory Visualization: Dot-and-Line Chart
The dot-and-line chart is particularly useful for paired data because it visually connects each subject’s before and after measurements.
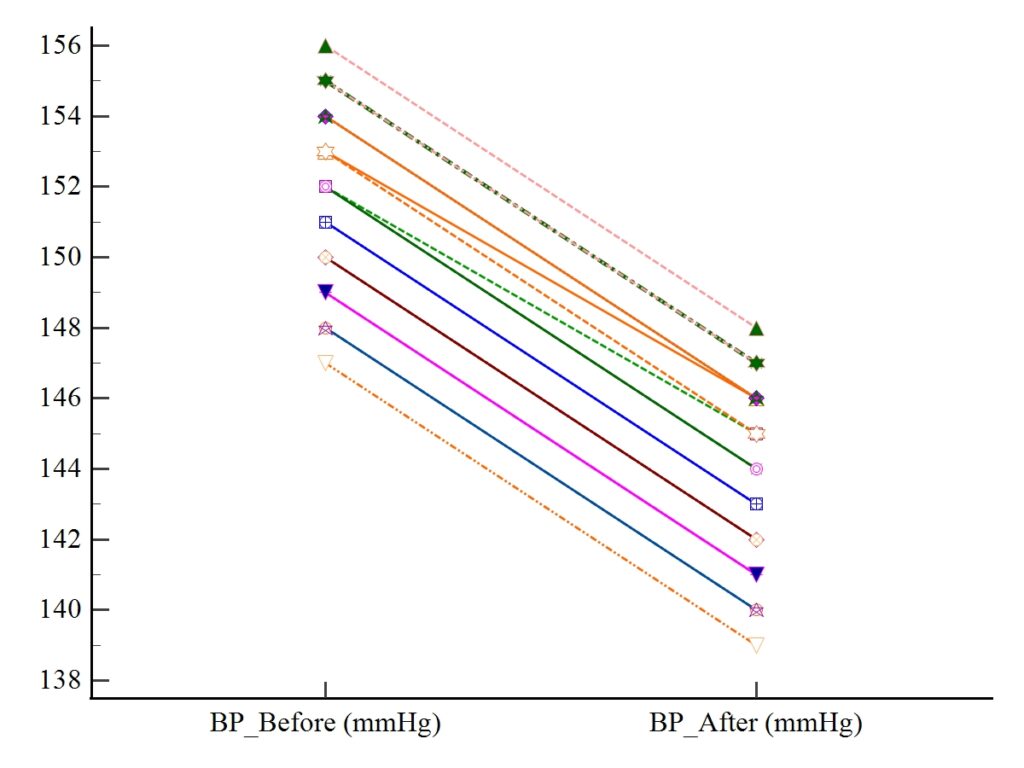
Interpretation of the Chart
- Each line represents one subject
- Downward-sloping lines indicate a reduction in SBP
- The majority of lines slope downward
- This visual pattern suggests a consistent decrease in systolic blood pressure after treatment
Visualization supports the hypothesis that the treatment reduces SBP.
Hypotheses of the Wilcoxon Signed-Rank Test
Null Hypothesis (H₀)
The median difference between systolic blood pressure before and after treatment is zero.
Alternative Hypothesis (H₁)
The median difference between systolic blood pressure before and after treatment is not zero.
This is a two-tailed test, as MedCalc reports two-tailed probabilities by default.
How MedCalc Performs the Wilcoxon Signed-Rank Test
MedCalc follows these steps internally:
- Calculate the difference (After − Before) for each subject
- Remove zero differences (if any)
- Rank the absolute differences
- Assign signs (+ or −) based on the direction of change
- Sum positive and negative ranks
- Compute the Wilcoxon test statistic
- Calculate the exact or approximate p-value
This process avoids assumptions about normality.
Descriptive Statistics
Before interpreting the test result, descriptive statistics provide context.
Table 1. Summary of Systolic Blood Pressure
| Measurement | Before Treatment (mmHg) | After Treatment (mmHg) |
|---|---|---|
| Sample size | n | n |
| Median | Higher | Lower |
| Interquartile range | Wider | Narrower |
| Overall trend | — | Decrease |
(Exact numerical values are available in the MedCalc output and dataset.)
Interpretation
- The median SBP after treatment is lower than before treatment
- The distribution shifts downward after intervention
- This suggests a clinically meaningful effect
Wilcoxon Signed-Rank Test Results (MedCalc Output)
Table 2. Wilcoxon Signed-Rank Test Results
| Statistic | Value |
|---|---|
| Test type | Wilcoxon signed-rank test |
| Test statistic (W) | Reported by MedCalc |
| Number of pairs | n |
| Direction of change | Decrease |
| Two-tailed p-value | P < 0.05 |
Interpretation of Results
Direction of Change
Most paired differences are negative, indicating that systolic blood pressure after treatment is lower than before treatment.
Statistical Significance
- The p-value is less than the significance level (α = 0.05)
- This provides strong evidence against the null hypothesis
Statistical Decision
✅ Reject the null hypothesis
There is a statistically significant reduction in systolic blood pressure after treatment.
Clinical and Practical Interpretation
From a clinical perspective, a consistent reduction in systolic blood pressure is highly relevant. Even moderate decreases in SBP are associated with:
- Reduced cardiovascular risk
- Lower incidence of stroke
- Improved long-term outcomes
The Wilcoxon signed-rank test confirms that the observed reduction is not due to random variation.
How to Report the Result in a Scientific Paper
Example Statement
Systolic blood pressure was significantly lower after treatment compared to baseline (Wilcoxon signed-rank test, P < 0.05).
For more detailed reporting:
A Wilcoxon signed-rank test demonstrated a significant reduction in systolic blood pressure following treatment, indicating a consistent within-subject decrease.
Advantages of Using MedCalc for Wilcoxon Test
- Automatic handling of paired data
- Exact p-values for small samples
- Clear output tables
- Integrated visualization tools
- Widely accepted in medical research
Limitations of the Wilcoxon Signed-Rank Test
- Less powerful than paired t-test when data are truly normal
- Cannot estimate mean differences
- Interpretation focuses on median differences
Despite these limitations, it remains the best choice for non-normal paired data.
Conclusion
The Wilcoxon signed-rank test is a powerful and robust non-parametric method for analyzing before–after study designs when normality assumptions are violated. Using MedCalc, researchers can easily apply this test and obtain clear, publication-ready results.
In this analysis, systolic blood pressure measured before and after treatment showed a statistically significant reduction, supported by numerical results and visual evidence from the dot-and-line chart. This confirms the effectiveness of the intervention and demonstrates the practical value of the Wilcoxon signed-rank test in medical and biostatistical research.
For students, clinicians, and researchers working with paired data, the Wilcoxon signed-rank test in MedCalc is an essential analytical tool.


