
In biomedical and clinical research, it is often necessary to study the combined effects of two independent factors on a continuous outcome variable. For example, researchers may want to understand how different treatments affect blood pressure and whether these effects vary between males and females. In such situations, Two-Way Analysis of Variance (Two-Way ANOVA) is the most appropriate statistical technique.
Two-Way ANOVA allows researchers to:
- Examine the main effect of each factor independently
- Assess whether there is an interaction effect between factors
- Improve statistical efficiency by analyzing multiple factors simultaneously
STUDY OBJECTIVE
The main objectives of this analysis are:
- To determine whether treatment type significantly affects systolic blood pressure
- To assess whether gender influences systolic blood pressure
- To evaluate whether there is a treatment × gender interaction effect
- To verify the normality assumption using the Shapiro–Wilk test
DATA DESCRIPTION
The dataset consists of 18 observations with the following variables:
| Variable Name | Description |
|---|---|
| Systolic_BP | Systolic blood pressure (mmHg) |
| Treatment | Drug A, Drug B, Drug C |
| Gender | Male, Female |
Each treatment group contains an equal number of male and female participants, ensuring a balanced factorial design, which is ideal for Two-Way ANOVA.
Download Dataset (Excel – Two-Way ANOVA Example)
BOX PLOT VISUALIZATION
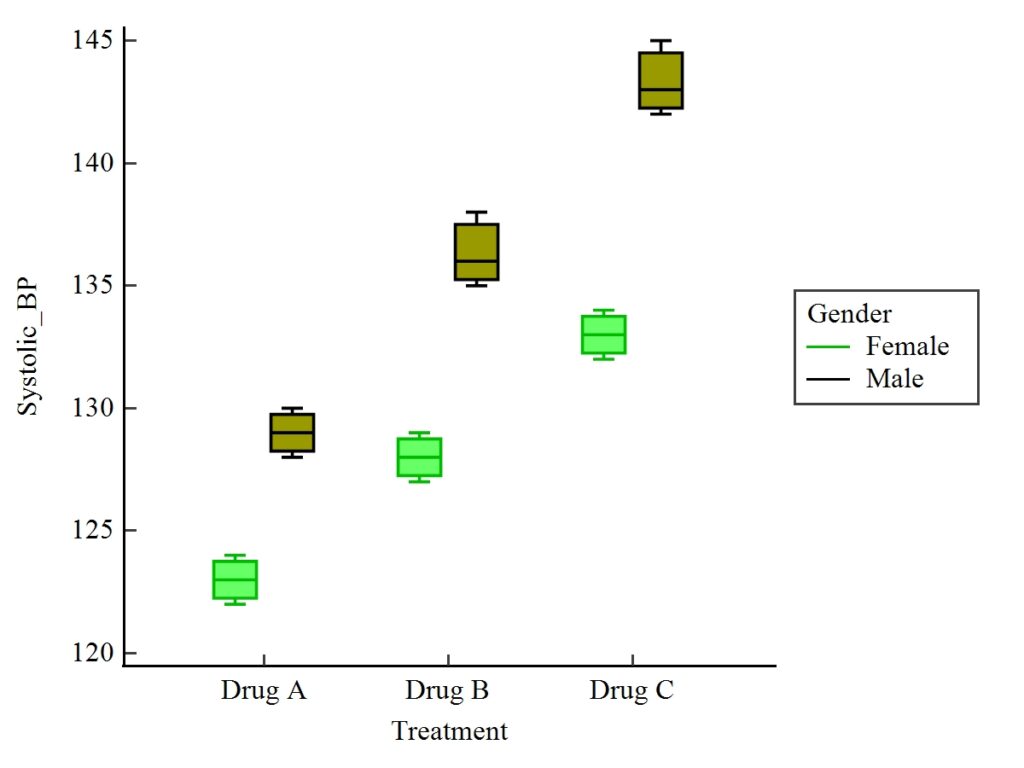
The box plot visually demonstrates:
- Increasing blood pressure from Drug A → Drug C
- Higher systolic BP values in males compared to females
- Clear separation between treatment groups
This visualization helps readers understand the data pattern before statistical testing.
STATISTICAL METHODOLOGY
Why Two-Way ANOVA?
Two-Way ANOVA is used when:
- The dependent variable is continuous
- There are two categorical independent variables
- Data are approximately normally distributed
- Variances are reasonably homogeneous
In this study:
- Dependent variable: Systolic blood pressure
- Factors: Treatment (3 levels) and Gender (2 levels)
ASSUMPTION CHECK: SHAPIRO–WILK TEST
Before performing ANOVA, it is essential to verify the normality of residuals.
Shapiro–Wilk Test Result
| Statistic | Value |
|---|---|
| W | 0.9043 |
| P-value | 0.0684 |
Since P > 0.05, the null hypothesis of normality is accepted.
✅ Conclusion:
The residuals follow an approximately normal distribution, satisfying one of the key assumptions of Two-Way ANOVA.
TWO-WAY ANOVA RESULTS (MEDCALC OUTPUT)
Levene’s Test for Homogeneity of Variance
| Test | P-value |
|---|---|
| Levene’s Test | 0.831 |
Because P > 0.05, the assumption of equal variances is satisfied.
Tests of Between-Subjects Effects
| Source | DF | F-value | P-value |
|---|---|---|---|
| Treatment | 2 | 153.731 | < 0.001 |
| Gender | 1 | 210.615 | < 0.001 |
| Treatment × Gender | 2 | 4.885 | 0.028 |
INTERPRETATION OF RESULTS
1. Main Effect of Treatment
The treatment effect is highly significant (P < 0.001).
🔹 This indicates that systolic blood pressure differs significantly among Drug A, Drug B, and Drug C.
Mean Systolic BP by Treatment:
| Treatment | Mean BP (mmHg) |
|---|---|
| Drug A | 126.00 |
| Drug B | 132.17 |
| Drug C | 138.17 |
Blood pressure increases progressively from Drug A to Drug C.
2. Main Effect of Gender
Gender also shows a statistically significant effect (P < 0.001).
| Gender | Mean BP (mmHg) |
|---|---|
| Female | 128.00 |
| Male | 136.22 |
🔹 Males have significantly higher systolic blood pressure than females across treatments.
3. Interaction Effect (Treatment × Gender)
The interaction between treatment and gender is statistically significant (P = 0.028).
🔹 This means:
- The effect of treatment on blood pressure differs between males and females
- Treatment outcomes cannot be interpreted independently of gender
This interaction is clearly visible in the box plot, where male BP values increase more steeply across treatments than female values.
POST HOC COMPARISONS
Bonferroni-corrected pairwise comparisons indicate:
Drug A vs Drug B → Significant
Drug A vs Drug C → Significant
Drug B vs Drug C → Significant
All pairwise differences show P < 0.0001, confirming that each treatment group differs significantly from the others.
SUMMARY STATISTICS
| Variable | Mean | SD |
|---|---|---|
| Systolic BP | 132.11 | 6.77 |
This reflects moderate variability in blood pressure measurements across the study population.
PRACTICAL IMPLICATIONS
- Two-Way ANOVA provides richer insight than One-Way ANOVA
- Gender should be considered when evaluating treatment efficacy
- MedCalc offers an intuitive interface for factorial ANOVA
- Visual tools (box plots) greatly enhance interpretation
CONCLUSION
This article demonstrated a complete Two-Way ANOVA analysis in MedCalc, using systolic blood pressure data to evaluate the effects of treatment, gender, and their interaction.
Key conclusions include:
- Treatment significantly influences systolic blood pressure
- Gender has a strong independent effect
- A meaningful interaction exists between treatment and gender
- All ANOVA assumptions were satisfied, including normality
Two-Way ANOVA is a powerful statistical method in medical and biological research, and MedCalc makes it accessible even for beginners. By combining statistical output with graphical visualization, researchers can confidently interpret complex experimental designs.


