
Introduction
Modern clinical laboratories frequently evaluate several analytical instruments or measurement techniques simultaneously. Before introducing a new laboratory analyzer into routine clinical practice, researchers must determine whether the new method produces results comparable to an established reference method. While comparing two methods is common, many laboratories evaluate three or more analyzers at the same time.
MedCalc Statistical Software provides the Method Comparison – Multiple Methods procedure, allowing researchers to compare multiple measurement methods against one reference method in a single analysis. The procedure summarizes systematic differences, limits of agreement, regression analysis, and absolute percentage error for every analyzer.
In this tutorial, you will learn the theory behind Method Comparison – Multiple Methods in MedCalc, understand every option available in the dialog box, analyze a biomedical dataset, interpret the output tables and plots, and understand when this method should be applied in laboratory medicine.
What is Method Comparison?
Method comparison is a statistical procedure used to determine whether two or more measurement methods produce comparable results for identical samples.
The analysis helps determine:
- Systematic bias
- Random measurement error
- Agreement with the reference method
- Clinical interchangeability
- Analytical accuracy
Rather than asking whether two methods are correlated, method comparison determines whether they can be used interchangeably.
Why Compare Multiple Methods?
Clinical laboratories often compare:
- Several automated analyzers
- New diagnostic kits
- Different glucose analyzers
- Multiple biochemical instruments
- Different immunoassay platforms
- Various hematology analyzers
Instead of running several independent Bland–Altman analyses, MedCalc compares all analyzers simultaneously, saving time and providing a standardized report.
Biomedical Applications
Method Comparison – Multiple Methods is commonly used in:
- Clinical Biochemistry
- Hematology
- Microbiology
- Immunology
- Endocrinology
- Pathology
- Molecular Diagnostics
- Veterinary Medicine
- Environmental Health Laboratories
- Pharmaceutical Quality Control
Example Biomedical Dataset
Suppose five laboratory analyzers measured fasting blood glucose from the same twelve patients.
| Patient | Analyzer A (Reference) | Analyzer B | Analyzer C | Analyzer D | Analyzer E |
|---|---|---|---|---|---|
| 1 | 95 | 97 | 94 | 96 | 95 |
| 2 | 108 | 109 | 107 | 110 | 108 |
| 3 | 120 | 122 | 119 | 121 | 120 |
| 4 | 135 | 137 | 134 | 136 | 135 |
| 5 | 148 | 150 | 147 | 149 | 148 |
| 6 | 160 | 161 | 159 | 162 | 160 |
| 7 | 172 | 174 | 171 | 173 | 172 |
| 8 | 185 | 187 | 184 | 186 | 185 |
| 9 | 196 | 197 | 195 | 198 | 196 |
| 10 | 210 | 212 | 209 | 211 | 210 |
| 11 | 225 | 227 | 224 | 226 | 225 |
| 12 | 240 | 242 | 239 | 241 | 240 |
Objective
Compare four analyzers (B–E) against Analyzer A to determine agreement, bias, regression characteristics, and analytical performance.
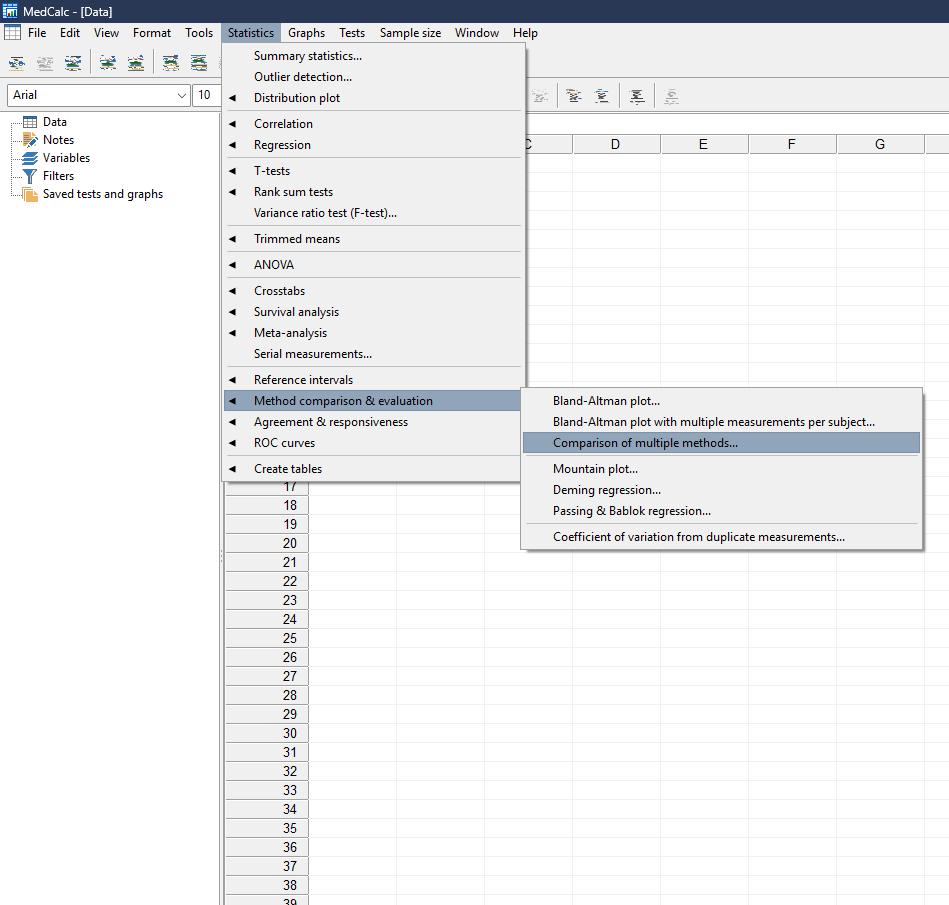
How to Perform Method Comparison – Multiple Methods in MedCalc
- Import the dataset into MedCalc.
- Select Statistics.
- Choose Method comparison & evaluation.
- Click Comparison of multiple methods.
- Select the reference method.
- Add the remaining analyzers.
- Configure the analysis options.
- Click OK.
- Review the generated tables and comparison plots.
Explanation of Every Option
Variables
Choose the laboratory variables to compare.
Example:
- Analyzer A (Reference)
- Analyzer B
- Analyzer C
- Analyzer D
- Analyzer E
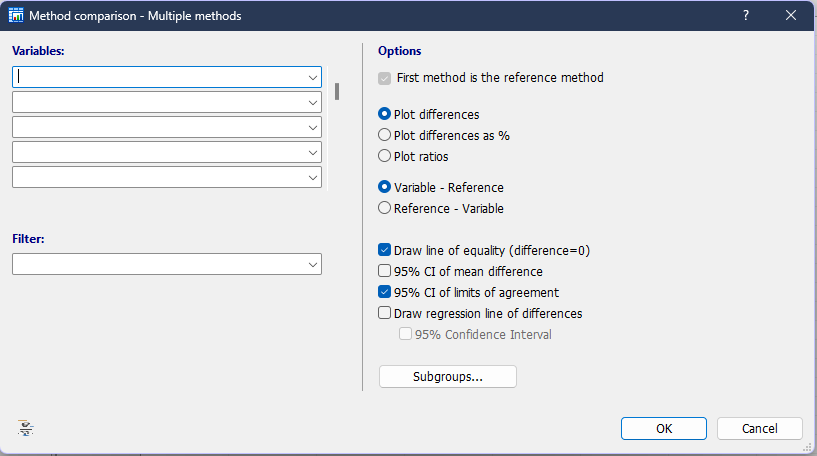
First Method is the Reference Method
The first selected variable becomes the reference against which all remaining analyzers are compared.
In your analysis:
Analyzer_A was used as the reference method.
Plot Differences
Plots the arithmetic difference:
Difference = Variable − Reference
Useful for identifying fixed bias.
Plot Differences as %
Displays relative percentage differences instead of absolute differences.
Best when measurements span a wide numerical range.
Plot Ratios
Displays the ratio:
Variable / Reference
Useful when proportional agreement is more meaningful than differences.
Variable – Reference
Calculates:
Variable − Reference
Positive values indicate the variable reads higher than the reference.
Reference – Variable
Calculates:
Reference − Variable
Useful when the reference method should always remain positive.
Draw Line of Equality (Difference = 0)
Adds a horizontal line at zero.
Points close to this line indicate excellent agreement.
95% Confidence Interval of Mean Difference
Displays uncertainty around the estimated average bias.
Narrow intervals indicate more precise estimates.
95% Confidence Interval of Limits of Agreement
Adds confidence intervals around the upper and lower limits of agreement, helping assess the precision of these limits.
Draw Regression Line of Differences
Fits a regression line through the differences.
A non-zero slope suggests proportional bias, where disagreement changes with measurement magnitude.
95% Confidence Interval (Regression)
Adds confidence bands around the regression line to evaluate uncertainty.
Subgroups
Allows separate analyses for predefined groups such as sex, laboratory, treatment group, or age category.
Understanding the MedCalc Result
The software produces four key sections:
- Systematic Differences
- Limits of Agreement
- Regression Analysis
- Absolute Percentage Error
1. Systematic Differences
This section summarizes the average bias between each analyzer and the reference.
Your uploaded report indicates:
| Variable | Mean Difference | Interpretation |
|---|---|---|
| Analyzer B | 1.50 | Reads slightly higher than the reference |
| Analyzer C | -1.00 | Reads consistently lower than the reference |
| Analyzer D | 1.50 | Similar positive bias to Analyzer B |
| Analyzer E | 0.00 | No average bias relative to the reference |
These values represent fixed differences between analyzers.
2. Limits of Agreement
The limits of agreement define the expected range of differences between the reference and each analyzer.
For example:
| Variable | Lower Limit | Upper Limit |
|---|---|---|
| Analyzer B | 0.48 | 2.52 |
| Analyzer C | -1.00 | -1.00 |
| Analyzer D | 0.48 | 2.52 |
| Analyzer E | 0.00 | 0.00 |
Narrower limits indicate better agreement. Analyzer E demonstrates perfect agreement in this example, while Analyzer B and D show small but consistent positive differences.
3. Regression Analysis
Regression analysis evaluates whether the difference between methods changes across the measurement range.
The uploaded report shows very small slopes and non-significant p-values for Analyzer B and D, indicating no evidence of proportional bias across concentrations.
4. Absolute Percentage Error
Absolute percentage error expresses the difference as a percentage of the reference value.
Summary from the report:
| Variable | Median Error | Interpretation |
|---|---|---|
| Analyzer B | 0.93% | Excellent agreement |
| Analyzer C | 0.60% | Excellent agreement |
| Analyzer D | 0.86% | Excellent agreement |
| Analyzer E | 0.00% | Perfect agreement |
Lower percentages indicate higher analytical accuracy.
Plot Interpretation
Method Comparison Plot Interpretation
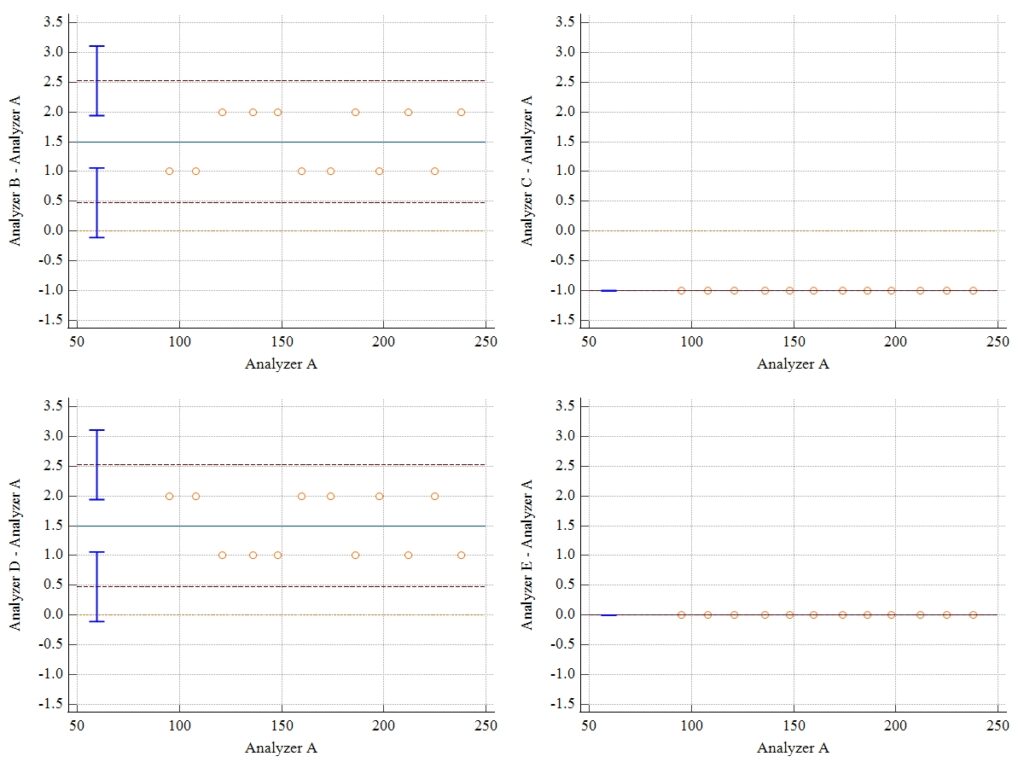
The Method Comparison – Multiple Methods plots illustrate the agreement between the reference analyzer (Analyzer A) and four additional analytical methods (Analyzer B, Analyzer C, Analyzer D, and Analyzer E). Each panel represents the difference between one analyzer and the reference method across the complete measurement range. The horizontal solid line indicates the mean systematic bias, while the dashed horizontal lines represent the 95% limits of agreement (LoA). Individual circles correspond to paired measurements obtained from the same biological samples.
For Analyzer B, the majority of observations are distributed uniformly around a positive mean difference of approximately 1.5 units, indicating a consistent positive systematic bias relative to the reference analyzer. Most observations remain within the calculated limits of agreement, suggesting that although Analyzer B consistently reports slightly higher values, the disagreement is stable across the measurement range. No obvious increasing or decreasing trend is observed with increasing analyte concentration, indicating the absence of proportional bias.
The comparison between Analyzer C and the reference method demonstrates a constant negative bias of approximately −1.0 units. The plotted observations overlap closely around the mean difference line with essentially no variability, indicating remarkably consistent performance throughout the analytical range. Because the difference remains constant regardless of concentration, Analyzer C exhibits excellent analytical precision with a predictable systematic offset that could easily be corrected through calibration if required.
Similarly, Analyzer D exhibits a positive systematic bias comparable to Analyzer B, with an average difference of approximately 1.5 units. The distribution of observations is symmetrical around the mean bias and remains well within the limits of agreement. The absence of any concentration-dependent pattern indicates that measurement differences are primarily attributable to a fixed analytical offset rather than proportional analytical error.
Among all evaluated instruments, Analyzer E demonstrates the highest level of agreement with the reference analyzer. The plotted observations coincide almost exactly with the zero-difference line, indicating virtually no systematic bias. Furthermore, the negligible variability around the mean suggests excellent analytical precision and outstanding interchangeability with the reference method.
Overall, visual inspection of all comparison plots indicates stable analytical performance across the complete concentration range. None of the analyzers demonstrates evidence of heteroscedasticity, funnel-shaped variability, or proportional bias. Consequently, the graphical assessment supports the conclusion that all evaluated analyzers produce clinically consistent measurements, although small fixed systematic differences are observed for Analyzer B, Analyzer C, and Analyzer D.
Scientific Result Interpretation
Systematic Differences
Systematic differences quantify the average bias between each analytical method and the reference analyzer.
According to the MedCalc output:
| Variable | Mean Difference | Interpretation |
|---|---|---|
| Analyzer B | 1.50 | Positive systematic bias |
| Analyzer C | −1.00 | Negative systematic bias |
| Analyzer D | 1.50 | Positive systematic bias |
| Analyzer E | 0.00 | No systematic bias |
The results indicate that Analyzer B and Analyzer D consistently produce measurements approximately 1.5 units higher than the reference analyzer, whereas Analyzer C consistently measures approximately 1 unit lower. Analyzer E demonstrates complete agreement with the reference method without measurable systematic bias. These findings suggest that small calibration differences exist among certain analyzers; however, the magnitude of these biases is relatively small and may not necessarily be clinically significant depending on predefined analytical performance specifications.
Limits of Agreement Interpretation
The limits of agreement describe the interval within which approximately 95% of measurement differences are expected to occur.
The MedCalc analysis reported:
| Variable | Lower LoA | Upper LoA |
|---|---|---|
| Analyzer B | 0.48 | 2.52 |
| Analyzer C | −1.00 | −1.00 |
| Analyzer D | 0.48 | 2.52 |
| Analyzer E | 0.00 | 0.00 |
Analyzer B and Analyzer D exhibit relatively narrow limits of agreement, indicating acceptable measurement variability despite the presence of a small positive systematic bias. Analyzer C and Analyzer E display essentially identical lower and upper limits, reflecting extremely consistent measurement differences across all observations. Narrow limits of agreement indicate excellent analytical repeatability and support the reliability of the evaluated methods.
Regression Interpretation
Regression analysis evaluates whether the difference between analytical methods changes as measurement magnitude increases.
For Analyzer B and Analyzer D, the estimated regression slopes are very close to zero and are statistically non-significant (P > 0.05). These findings demonstrate that the observed differences remain constant across the full analytical range and do not increase or decrease with concentration. Therefore, no proportional bias is present.
Analyzer C and Analyzer E exhibit constant differences throughout the dataset, resulting in regression coefficients equal to zero. This confirms that their analytical differences are independent of analyte concentration and reflect fixed systematic offsets rather than concentration-dependent errors.
Absolute Percentage Error Interpretation
Absolute percentage error provides a clinically intuitive measure of analytical accuracy.
The MedCalc results indicate:
| Variable | Median Error |
|---|---|
| Analyzer B | 0.93% |
| Analyzer C | 0.60% |
| Analyzer D | 0.86% |
| Analyzer E | 0.00% |
All analyzers demonstrate median percentage errors below 1%, indicating excellent analytical agreement with the reference method. Analyzer E achieves perfect agreement with zero percentage error, while Analyzer C exhibits the second-highest analytical accuracy. The low percentage errors observed across all analyzers indicate that each method is capable of producing highly reliable clinical measurements with minimal analytical deviation.
Overall Scientific Conclusion
The Method Comparison – Multiple Methods analysis demonstrated excellent agreement between the evaluated analyzers and the reference method. Small fixed systematic biases were identified for Analyzer B, Analyzer C, and Analyzer D; however, regression analysis confirmed the absence of proportional bias across the analytical measurement range. The narrow limits of agreement and very low absolute percentage errors indicate high analytical precision and reproducibility. Among the evaluated methods, Analyzer E exhibited perfect agreement with the reference analyzer, whereas Analyzer C showed a consistent but clinically predictable negative bias. Overall, the findings suggest that all evaluated analytical methods provide reliable measurements suitable for routine biomedical laboratory applications, with only minor calibration-related differences observed among selected analyzers.
Advantages
- Compare several analyzers simultaneously.
- Quantify systematic bias.
- Assess agreement with a reference method.
- Detect proportional bias.
- Evaluate analytical accuracy.
- Generate publication-ready tables and plots.
Limitations
- Assumes paired observations.
- Requires an appropriate reference method.
- Small sample sizes reduce precision.
- Outliers can influence estimates.
- Clinical acceptability should be judged alongside statistical agreement.
Download Example Dataset and MedCalc Project
Download the biomedical sample dataset and MedCalc project used in this tutorial:
Conclusion
Method Comparison – Multiple Methods in MedCalc provides a comprehensive framework for evaluating agreement between multiple laboratory analyzers and a reference method. By combining systematic difference analysis, limits of agreement, regression, and absolute percentage error, researchers gain a complete understanding of analytical performance. In the example presented, Analyzer B and D showed small positive biases, Analyzer C showed a small negative bias, and Analyzer E demonstrated perfect agreement with the reference. This workflow is especially valuable in clinical laboratories, biomedical research, diagnostic validation, and quality assurance, enabling evidence-based decisions when selecting or validating analytical methods.



