Introduction
Reference intervals are among the most important tools in clinical laboratories and biomedical research. They help researchers and healthcare professionals determine whether a patient’s laboratory measurement falls within the expected range for a healthy population.
MedCalc provides a dedicated Reference Interval Analysis module that follows internationally accepted CLSI C28-A3 guidelines and offers multiple approaches for calculating reference intervals, including Normal Distribution, Percentile Method, and Robust Method.
In this tutorial, we will learn how to perform Reference Interval Analysis in MedCalc, understand every available option, interpret the results and graphs, and apply the findings to biomedical datasets.
Download Files
What is a Reference Interval?
A Reference Interval (RI) is the range of values expected in a healthy reference population.
Most clinical laboratories use:
95% Reference Interval
This means:
- Lower limit = 2.5th percentile
- Upper limit = 97.5th percentile
Approximately 95% of healthy individuals will have measurements within this range.
Example:
If fasting glucose reference interval is:
75–130 mg/dL
Values inside this range are considered normal, while values outside may indicate abnormal physiological conditions.
Why is Reference Interval Analysis Important?
Reference intervals are widely used in:
- Clinical pathology
- Medical diagnostics
- Endocrinology
- Pharmacology
- Public health studies
- Veterinary medicine
- Biomedical research
Applications include:
- Blood glucose assessment
- Cholesterol evaluation
- Hemoglobin measurement
- Liver enzyme interpretation
- Kidney function assessment
Example Biomedical Dataset
Suppose a laboratory measures fasting glucose levels from healthy adults.
| Subject | Fasting Glucose (mg/dL) |
|---|---|
| 1 | 78 |
| 2 | 82 |
| 3 | 85 |
| 4 | 88 |
| 5 | 90 |
| 6 | 92 |
| 7 | 95 |
| 8 | 97 |
| 9 | 99 |
| 10 | 102 |
| 11 | 104 |
| 12 | 106 |
| 13 | 108 |
| 14 | 110 |
| 15 | 112 |
| 16 | 115 |
| 17 | 118 |
| 18 | 120 |
| 19 | 122 |
| 20 | 125 |
This dataset is used for calculating the reference interval.
Step-by-Step Analysis in MedCalc
Step 1: Import Data
Open MedCalc and import the fasting glucose dataset.
Step 2: Open Reference Interval Module
Navigate to:
Statistics → Clinical Laboratory → Reference Interval
The Reference Interval dialog box appears.
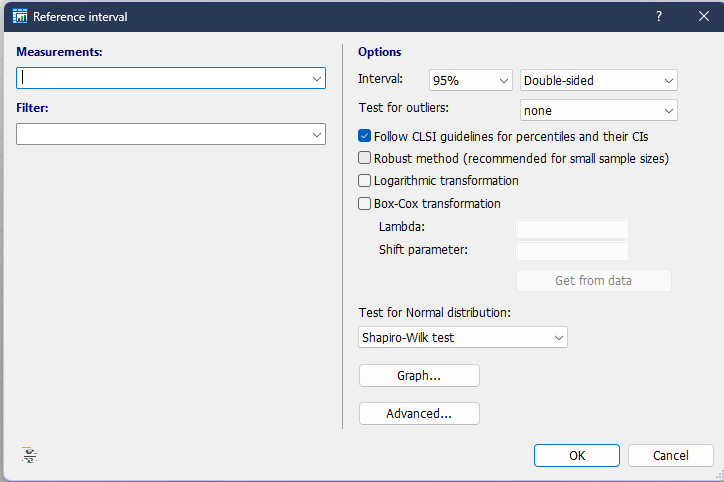
Variable Selection
Measurements
Select:
Fasting_Glucose_mg_dL
This variable contains fasting glucose measurements.
Filter
Leave blank unless subgroup analysis is required.
Explanation of All Options
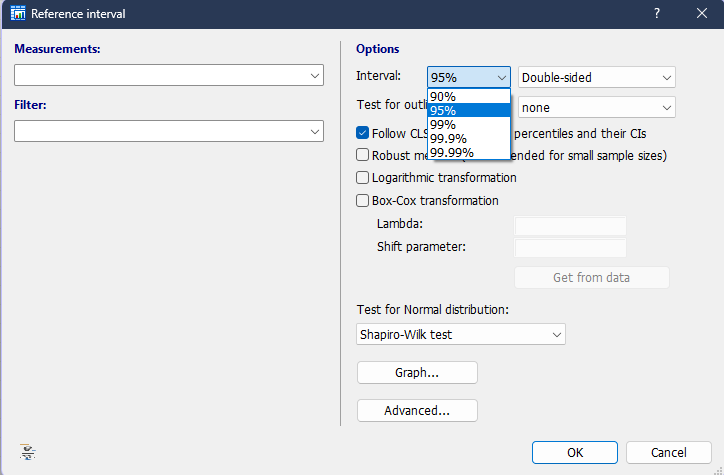
1. Interval
Available options:
- 90%
- 95%
- 99%
- 99.9%
- 99.99%
Recommended Selection
95%
Reason:
95% reference intervals are internationally accepted and recommended by CLSI guidelines.
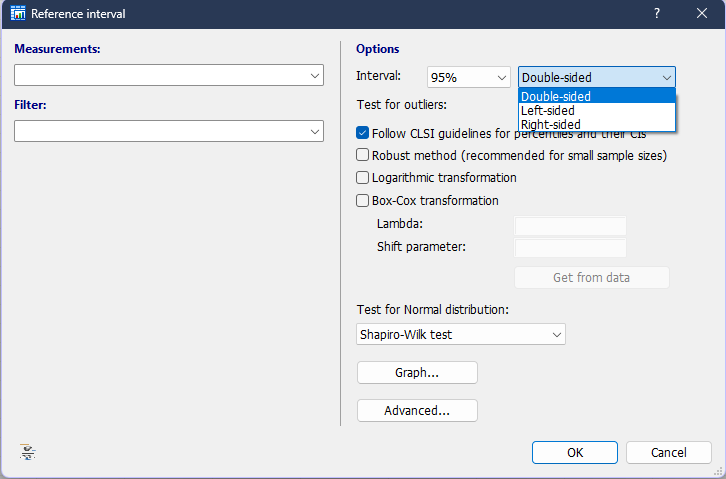
2. Double-Sided, Left-Sided and Right-Sided
Double-Sided
Calculates both lower and upper limits.
Example:
75–130 mg/dL
Most commonly used option.
Left-Sided
Calculates only lower limit.
Useful when low values indicate disease.
Right-Sided
Calculates only upper limit.
Useful when elevated values indicate disease.
Recommended
Double-Sided
3. Test for Outliers
Available options:
- None
- Reed
- Tukey
None
No outlier detection.
Reed Method
Recommended for clinical laboratory data.
Detects extreme observations.
Tukey Method
Uses interquartile range (IQR).
Effective for larger datasets.
Recommended
Reed Method
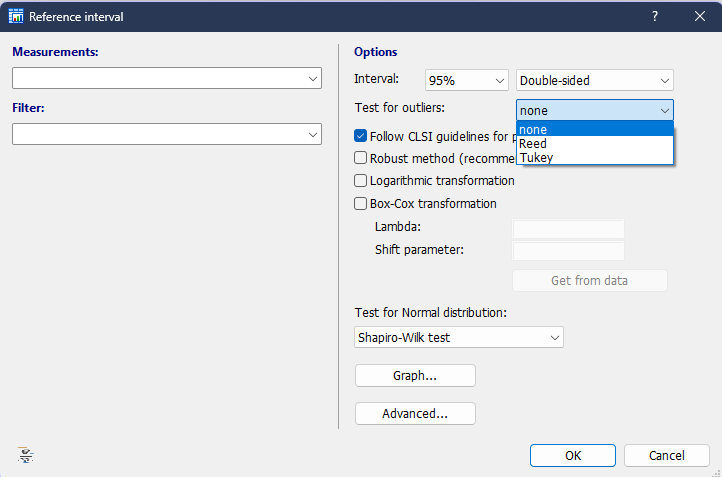
. Follow CLSI Guidelines for Percentiles and their Confidence Intervals
When selected:
- Uses CLSI C28-A3 recommendations.
- Calculates percentile-based reference intervals.
Recommended
✔ Checked
5. Robust Method
Recommended when:
- Sample size is small
- Data slightly deviate from normality
Produces stable estimates.
Recommended
✔ Checked
6. Logarithmic Transformation
Transforms skewed data.
Useful when measurements are positively skewed.
For Current Dataset
Not required.
7. Box-Cox Transformation
Advanced transformation method.
Improves normality.
For Current Dataset
Not necessary.
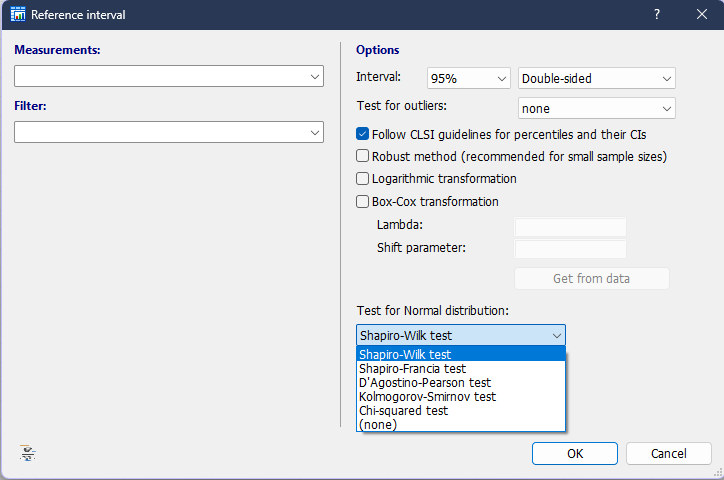
8. Test for Normal Distribution
Available tests:
- Shapiro-Wilk
- Shapiro-Francia
- D’Agostino-Pearson
- Kolmogorov-Smirnov
- Chi-square
Recommended
Shapiro-Wilk Test
Most powerful for small datasets.
Bootstrap Options for Robust Method
From your screenshot:
Bootstrap Replications
Value:
10000
Meaning:
MedCalc resamples data 10,000 times.
Produces stable confidence intervals.
Recommended
10000
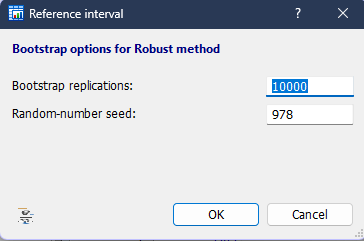
Random Number Seed
Value:
978
Purpose:
Ensures reproducible results.
Anyone using the same dataset and settings can reproduce identical confidence intervals.
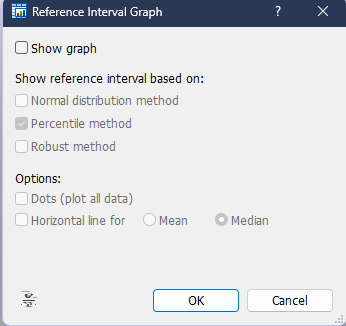
Graph Options
Show Graph
Displays graphical reference interval results.
Recommended:
✔ Checked
Show Reference Interval Based On
Options:
- Normal Distribution Method
- Percentile Method
- Robust Method
Recommended:
✔ Percentile Method
✔ Robust Method
Dots (Plot All Data)
Displays individual observations.
Recommended:
✔ Checked
Horizontal Line For
Options:
- Mean
- Median
Recommended:
✔ Median
Median is less influenced by extreme values.
Results Obtained
According to your MedCalc output:
Descriptive Statistics
| Statistic | Value |
|---|---|
| Sample Size | 20 |
| Lowest Value | 78 |
| Highest Value | 125 |
| Mean | 102.40 |
| Median | 103 |
| SD | 13.92 |
Normality Test
| Test | Result |
|---|---|
| Shapiro-Wilk W | 0.9721 |
| P-value | 0.7985 |
Interpretation:
Since P > 0.05:
✅ Data follow a normal distribution.
Outlier Analysis
| Method | Result |
|---|---|
| Reed Test | No Outliers |
Interpretation:
No suspicious observations detected.
Reference Interval Results
Normal Distribution Method
| Parameter | Value |
|---|---|
| Lower Limit | 75.11 |
| Upper Limit | 129.69 |
Percentile Method (CLSI)
| Parameter | Value |
|---|---|
| Lower Limit | 78 |
| Upper Limit | 125 |
Robust Method
| Parameter | Value |
|---|---|
| Lower Limit | 72.35 |
| Upper Limit | 132.63 |
Confidence Interval Interpretation
Robust Method
Lower Limit
72.35 mg/dL
90% CI:
64.68 – 81.83 mg/dL
Upper Limit
132.63 mg/dL
90% CI:
123.59 – 139.71 mg/dL
Interpretation:
The true population reference limits are expected to lie within these confidence intervals.
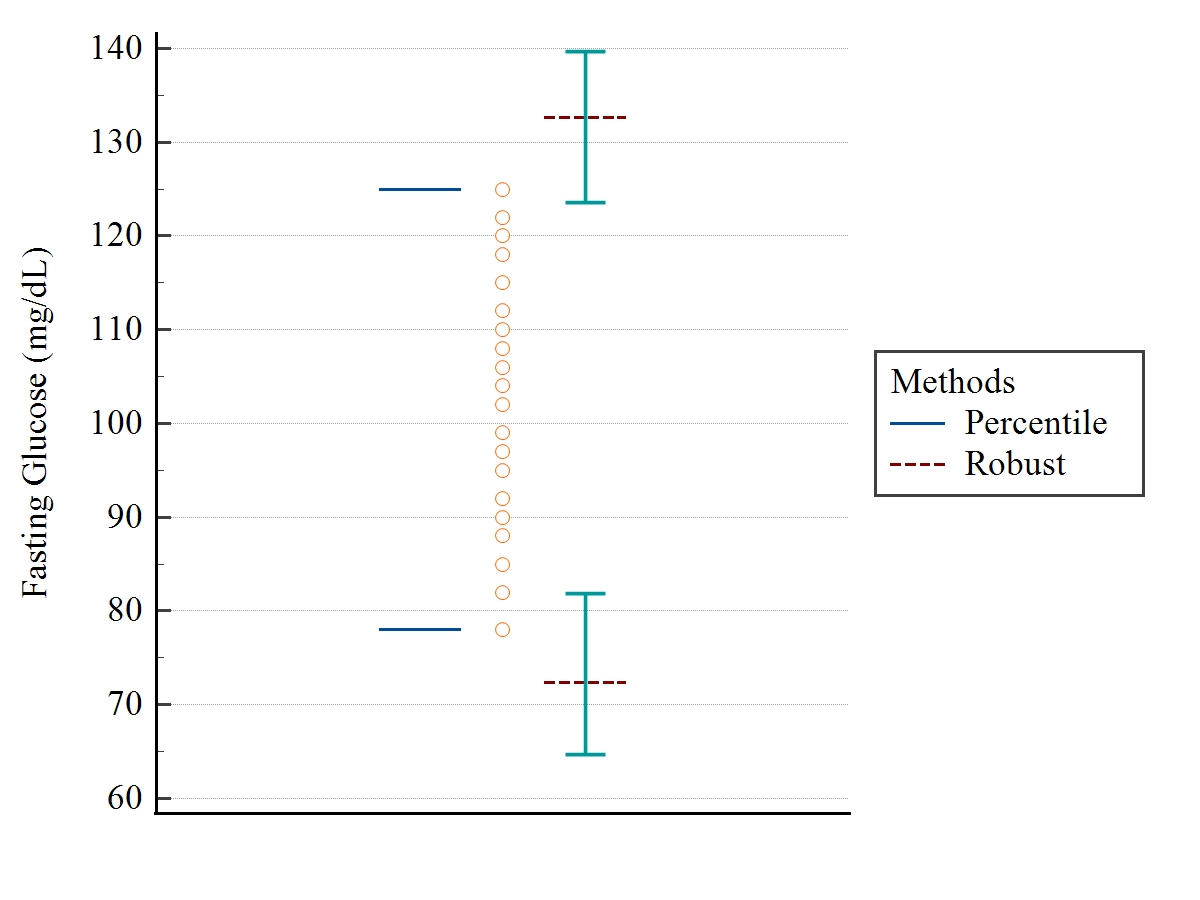
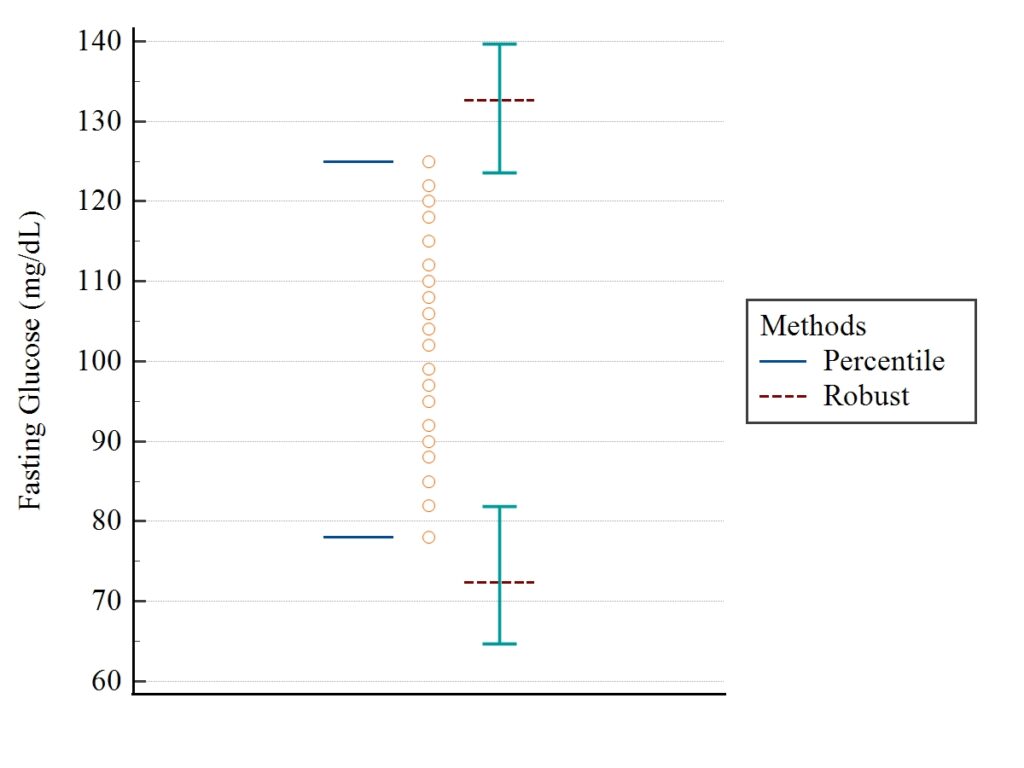
Graph Interpretation
The graph compares:
Percentile Method
Blue lines
Reference interval:
78–125 mg/dL
Robust Method
Red dashed lines
Reference interval:
72.35–132.63 mg/dL
Individual Data Points
Orange circles represent observed fasting glucose measurements.
Interpretation
- All observations fall within expected limits.
- No extreme outliers detected.
- Robust method produces slightly wider limits.
- Results indicate a healthy reference population.
Clinical Interpretation
For this dataset:
Reference interval approximately ranges from:
72 to 133 mg/dL
A patient with fasting glucose:
- 90 mg/dL → Normal
- 115 mg/dL → Normal
- 140 mg/dL → Above reference interval
- 65 mg/dL → Below reference interval
Thus, clinicians can use this interval for patient evaluation.
Advantages of Reference Interval Analysis in MedCalc
- CLSI-compliant calculations
- Robust method support
- Outlier detection
- Confidence interval estimation
- Bootstrap analysis
- Publication-quality graphs
- Easy interpretation
Conclusion
Reference Interval Analysis in MedCalc is an essential tool for establishing normal laboratory ranges from healthy populations. By following CLSI guidelines and offering multiple approaches such as Normal Distribution, Percentile, and Robust Methods, MedCalc provides reliable and scientifically valid reference intervals.
In this example, fasting glucose data showed normal distribution, no significant outliers, and a clinically useful 95% reference interval. The percentile and robust approaches produced similar results, confirming the stability of the reference limits. These methods help researchers, clinicians, and laboratory scientists make evidence-based decisions and improve diagnostic accuracy.