
Introduction
When working with scientific data analysis and graphing software, understanding the user interface is the first step toward becoming productive. OriginPro is one of the world’s leading scientific graphing and data analysis applications used by researchers, engineers, students, and scientists. Before creating graphs or performing statistical analyses, users should become familiar with the OriginPro workspace and its major components.
The OriginPro interface is designed to provide quick access to data management, graphing tools, statistical analysis functions, and project organization features. While the software contains numerous advanced capabilities, its workspace follows a logical structure that makes it easy for beginners to learn.
This article provides a complete tour of the OriginPro interface based on the workspace shown in the image, helping new users understand every important section of the software.
What is the OriginPro Interface?
The OriginPro Interface refers to the complete workspace environment where users import data, organize projects, create graphs, perform analyses, and export results.
The interface consists of multiple interconnected components that work together to streamline scientific data analysis workflows.
Main Objectives of the Interface
- Organize data efficiently
- Access graphing tools quickly
- Perform statistical analyses
- Manage projects systematically
- Visualize results effectively
- Automate workflows
The workspace is designed to minimize the time required to move from raw data to publication-quality results.
Understanding the OriginPro Workspace
The OriginPro Workspace shows a standard OriginPro workspace immediately after creating a new project.
The workspace contains several important sections:
Figure 1: OriginPro Workspace Structure
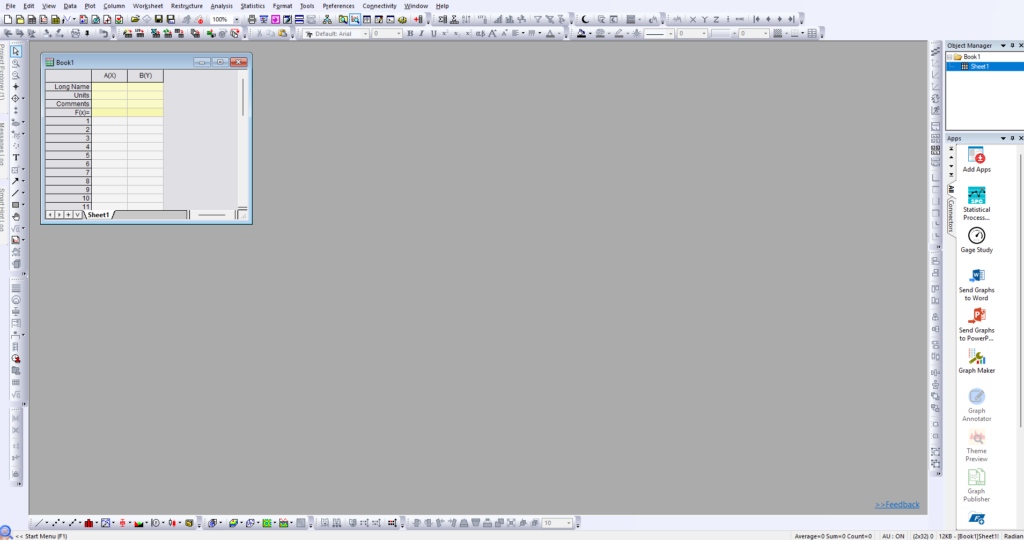
Each component has a specific role in the data analysis process.
1. Menu Bar
The Menu Bar is located at the top of the OriginPro window.
| Menu | Purpose |
|---|---|
| File | Create, open, save projects |
| Edit | Copy, paste, modify objects |
| View | Workspace customization |
| Data | Data management tools |
| Plot | Graph creation commands |
| Column | Column operations |
| Worksheet | Worksheet management |
| Analysis | Statistical analyses |
| Statistics | Statistical tests |
| Format | Formatting options |
| Tools | Additional utilities |
| Preferences | Software settings |
| Connectivity | Data connections |
| Window | Window arrangement |
| Help | Documentation and support |
Why It Matters
The Menu Bar acts as the primary gateway to all OriginPro features.
Most advanced analyses can be accessed through the Analysis and Statistics menus.
2. Standard Toolbar
Directly below the Menu Bar is the Toolbar section.
This area contains shortcuts for frequently used commands.
Common Toolbar Functions
- New Project
- Open Project
- Save Project
- Cut
- Copy
- Paste
- Undo
- Redo
- Zoom
- Graph Tools
Using toolbar shortcuts can significantly improve productivity compared to navigating menus repeatedly.
3. Worksheet Window
The worksheet visible in the center-left portion of the screenshot is the primary data entry area.
The worksheet behaves similarly to a spreadsheet.
Components of a Worksheet
| Section | Description |
|---|---|
| Column Header | Column names |
| Long Name Row | Variable descriptions |
| Units Row | Measurement units |
| Comments Row | Notes |
| Formula Row | Calculation formulas |
| Data Cells | Numerical values |
In the screenshot:
- Column A is designated as X
- Column B is designated as Y
These designations are important because OriginPro automatically recognizes plotting relationships.
4. Workbook
The worksheet belongs to a workbook named Book1.
A workbook can contain multiple worksheets.
Example
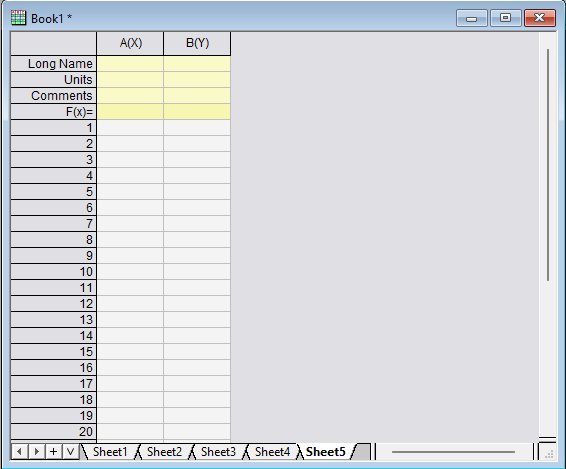
Researchers often store raw data, processed data, and analysis outputs within the same workbook.
Benefits
- Better organization
- Easier data management
- Reduced file clutter
5. Project Explorer Panel
The left side of the screenshot displays the Project Explorer tab.
Project Explorer acts as the central navigation system for the project.
Functions
- Manage workbooks
- Manage graphs
- Manage matrices
- Organize folders
- Access project components
Think of Project Explorer as the file manager inside OriginPro.
6. Object Manager
The top-right section of the interface contains the Object Manager panel.
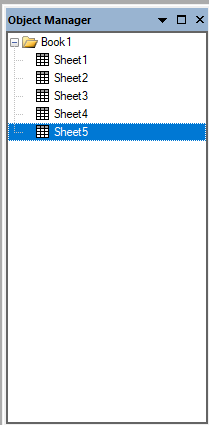
is displayed.
Purpose
Object Manager provides a hierarchical view of project contents.
It helps users:
- Locate worksheets
- Locate graphs
- Organize project items
- Navigate quickly
This becomes extremely useful in large projects containing hundreds of worksheets and graphs.
7. Apps Gallery
The right-side panel shows the Apps Gallery.
This section provides quick access to OriginPro add-on applications.
Examples visible in the screenshot include:
- Statistical Process Control
- Gage Study
- Send Graphs to Word
- Send Graphs to PowerPoint
- Graph Maker
- Graph Annotator
- Theme Preview
- Graph Publisher
Benefits
Apps extend OriginPro functionality without requiring additional programming.
8. Workspace Area
The large gray area in the center represents the workspace.
This area serves as the working canvas where users can open:
- Worksheets
- Graphs
- Matrices
- Reports
- Analysis Results
As projects grow, multiple windows can be arranged within this workspace.
9. Vertical Toolbars
Both sides of the interface contain toolbars.
Left Toolbar
Contains:
- Selection Tool
- Drawing Tools
- Text Tool
- Arrow Tool
- Zoom Tool
Right Toolbar
Contains:
- Graph Editing Tools
- Layer Management Tools
- Annotation Tools
These tools are particularly useful when editing graphs and creating publication-ready figures.
10. Status Bar
The bottom section of the interface contains the Status Bar.
It displays:
- Current worksheet
- Data information
- Cursor position
- Project status
- Memory usage
Step-by-Step Workflow Using the Interface
Step 1: Create a New Project
Choose:
File → New Project
A blank workspace opens.
Step 2: Enter Data
Input values into worksheet columns.
Example:
| Time | Growth |
|---|---|
| 1 | 2.3 |
| 2 | 3.5 |
| 3 | 4.8 |
| 4 | 6.2 |
| 5 | 7.1 |
Step 3: Assign Column Designations
Set:
Column A = XColumn B = Y
OriginPro automatically recognizes plotting variables.
Step 4: Create a Graph
Navigate to:
Plot → Scatter
A graph window is created instantly.
Step 5: Customize the Graph
Use:
- Format Menu
- Toolbar Tools
- Graph Editing Tools
Modify:
- Colors
- Fonts
- Symbols
- Axes
Step 6: Perform Statistical Analysis
Choose:
Analysis → Statistics
or
Statistics → ANOVA
OriginPro generates results automatically.
Step 7: Save the Project
Select:
File → Save Project
The entire workspace—including data, graphs, and analysis results—is saved together.
Example: Creating Your First Graph
Suppose a researcher measures enzyme activity.
| Temperature (°C) | Activity |
|---|---|
| 20 | 15 |
| 25 | 22 |
| 30 | 35 |
| 35 | 48 |
| 40 | 41 |
Workflow
- Enter data into worksheet.
- Assign X and Y columns.
- Select both columns.
- Choose Scatter Plot.
- Customize graph appearance.
- Add axis labels.
- Export graph.
Output
OriginPro creates a publication-quality graph suitable for research papers and presentations.
Key Advantages of the OriginPro Interface
| Feature | Benefit |
|---|---|
| Worksheet-Based Design | Easy data entry |
| Object Manager | Quick navigation |
| Project Explorer | Better organization |
| Apps Gallery | Extended functionality |
| Toolbars | Faster workflow |
| Graph Workspace | Professional visualization |
| Analysis Menus | Advanced statistics |
Tips for Beginners
Use Column Labels Properly
Always define X and Y columns before plotting.
Organize Projects
Use folders in Project Explorer for large projects.
Save Frequently
Scientific projects often contain many linked objects.
Explore Apps
Many useful tools are available through the Apps Gallery.
Learn Shortcut Keys
Keyboard shortcuts can significantly increase productivity.
Why Understanding the Interface is Important
Many beginners focus immediately on graph creation without understanding the workspace.
Learning the interface first helps users:
- Work faster
- Avoid mistakes
- Organize projects efficiently
- Access advanced tools confidently
- Produce professional results
A strong understanding of the workspace creates a foundation for mastering all other OriginPro features.
Conclusion
The OriginPro interface provides a powerful yet user-friendly environment for scientific data analysis, visualization, and research reporting. The workspace consists of essential components such as the Menu Bar, Toolbars, Worksheet Window, Workbook, Project Explorer, Object Manager, Apps Gallery, and Status Bar. Together, these components create a complete ecosystem for managing data and generating high-quality analytical results.
For beginners, becoming familiar with the interface is the most important first step toward mastering OriginPro. Once users understand how the workspace is organized, they can efficiently import data, create graphs, perform statistical analyses, and produce publication-quality outputs. A solid understanding of the OriginPro interface ultimately leads to faster workflows, better data management, and more effective scientific research.



