
Introduction
Meta-analysis is a powerful statistical technique used to combine findings from multiple independent studies to obtain a more precise estimate of an effect. In biomedical and clinical research, Odds Ratio (OR) is one of the most frequently used effect size measures for binary outcomes.
MedCalc provides an easy-to-use Meta-Analysis module that allows researchers to calculate pooled Odds Ratios, evaluate heterogeneity, assess publication bias, and visualize results using Forest Plots and Funnel Plots.
In this tutorial, we will explain Meta-Analysis Odds Ratio in MedCalc using a biomedical dataset, interpret the generated results, explain every available option, and discuss the Forest Plot and Funnel Plot outputs.
What is Odds Ratio?
An Odds Ratio (OR) compares the odds of an event occurring in an intervention group with the odds of the same event occurring in a control group.
Formula
OR = (a/b) ÷ (c/d)
Where:
- a = Positive cases in intervention group
- b = Negative cases in intervention group
- c = Positive cases in control group
- d = Negative cases in control group
Interpretation
| Odds Ratio | Interpretation |
|---|---|
| OR = 1 | No difference between groups |
| OR > 1 | Event more likely in intervention group |
| OR < 1 | Event less likely in intervention group |
| OR = 0.43 | 57% lower odds in intervention group |
Why Use Odds Ratio Meta-Analysis?
Odds Ratio Meta-Analysis is commonly used in:
- Clinical trials
- Drug efficacy studies
- Epidemiological investigations
- Disease prevalence studies
- Public health research
- Systematic reviews
Examples:
- Vaccine effectiveness
- Cancer treatment outcomes
- COVID-19 interventions
- Antibiotic effectiveness
Example Biomedical Dataset
The following dataset was used for the analysis.
| Study | Treat Positive | Treat Total | Control Positive | Control Total |
|---|---|---|---|---|
| Study 1 | 30 | 200 | 60 | 200 |
| Study 2 | 28 | 180 | 52 | 180 |
| Study 3 | 40 | 250 | 78 | 250 |
| Study 4 | 35 | 220 | 65 | 220 |
| Study 5 | 48 | 300 | 92 | 300 |
| Study 6 | 42 | 280 | 85 | 280 |
| Study 7 | 36 | 240 | 70 | 240 |
| Study 8 | 39 | 260 | 75 | 260 |
Download Example Dataset
How to Enter Data in MedCalc
Create the following columns:
| Column Name |
|---|
| Study |
| Treat_Total |
| Treat_Positive |
| Control_Total |
| Control_Positive |
Enter all study information row-wise.
Running Meta-Analysis Odds Ratio in MedCalc
Step 1
Open:
Statistics → Meta-analysis → Odds Ratio
Step 2
Select:
Studies
- Study
Intervention Group
Total number of cases
- Treat_Total
Number with positive outcome
- Treat_Positive
Control Group
Total number of cases
- Control_Total
Number with positive outcome
- Control_Positive
Step 3
Configure analysis options.
Step 4
Click OK
MedCalc generates:
- Forest Plot
- Funnel Plot
- Pooled Odds Ratio
- Heterogeneity statistics
- Publication bias tests
MedCalc Options Explained
Forest Plot
Displays:
- Individual study Odds Ratios
- Confidence Intervals
- Pooled Effect
Purpose:
Visual comparison of all studies.
Marker Size Relative to Study Weight
The square size changes according to study importance.
Large square:
- Larger study
- More influence
Small square:
- Smaller study
- Less influence
Fixed Effect Model Weights
Assumes:
All studies estimate the same true effect.
Use when heterogeneity is low.
Random Effect Model Weights
Assumes:
True effects differ between studies.
Recommended for most biomedical meta-analyses.
Plot Pooled Effect – Fixed Effects Model
Displays pooled OR under fixed effect assumptions.
Plot Pooled Effect – Random Effects Model
Displays pooled OR under random effect assumptions.
Diamonds for Pooled Effects
Diamond shape represents:
- Combined effect size
- Confidence interval
Wider diamond:
- More uncertainty
Narrow diamond:
- Greater precision
Funnel Plot
Used to detect:
- Publication bias
- Small study effects
Forest Plot Interpretation
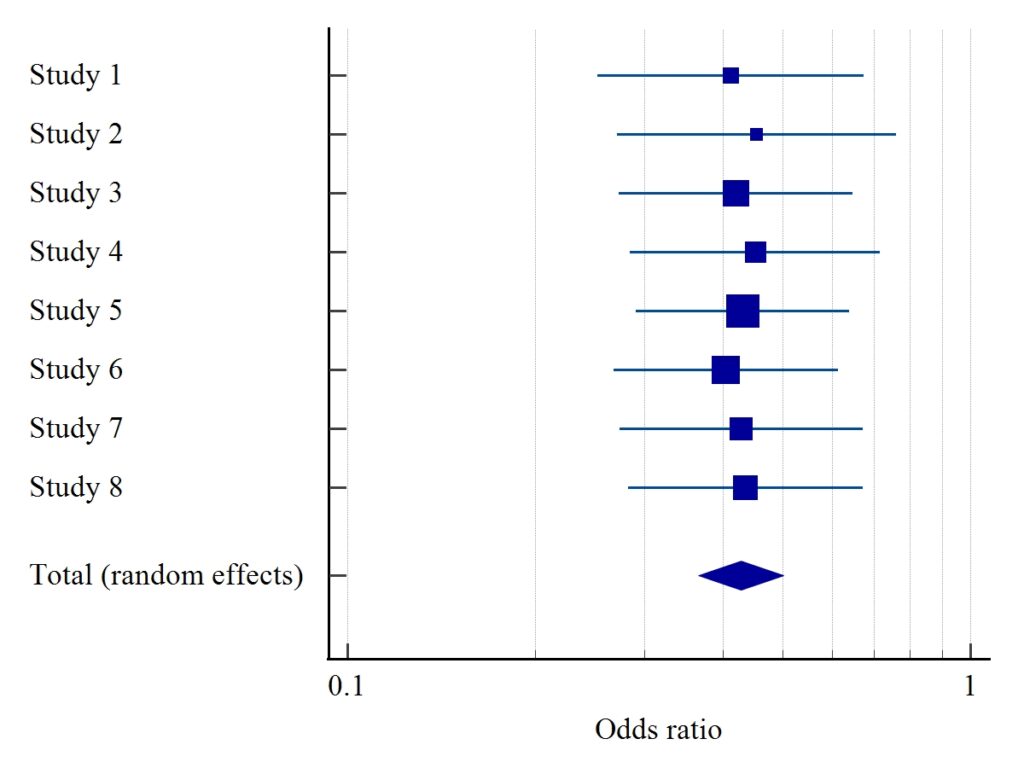
The Forest Plot shows:
- All individual studies
- Odds Ratios
- Confidence intervals
- Overall pooled Odds Ratio
Most studies reported OR values around:
0.40–0.45
The pooled estimate is represented by the blue diamond.
Since the pooled OR is below 1:
The intervention reduces the odds of the outcome compared to controls.
Meta-Analysis Results
The pooled Odds Ratio was:
OR = 0.428
95% CI:
0.366 to 0.501
P < 0.001
This indicates a statistically significant reduction in odds among the intervention group.
Results Table Interpretation
| Parameter | Value |
|---|---|
| Pooled OR | 0.428 |
| 95% CI | 0.366 – 0.501 |
| Z value | -10.57 |
| P value | <0.001 |
Interpretation:
The intervention group had approximately 57.2% lower odds of the outcome compared with controls.
Heterogeneity Analysis
Cochran’s Q
Q = 0.2045
Degrees of Freedom
DF = 7
P-value
P = 1.000
I² Statistic
I² = 0.00%
Interpretation:
There is no observed heterogeneity among studies. All studies are highly consistent.
Publication Bias Analysis
Egger’s Test
| Parameter | Value |
|---|---|
| Intercept | 0.7503 |
| P-value | 0.3502 |
Interpretation:
No evidence of publication bias.
Begg’s Test
| Parameter | Value |
|---|---|
| Kendall Tau | 0.2857 |
| P-value | 0.3223 |
Interpretation:
No significant publication bias detected.
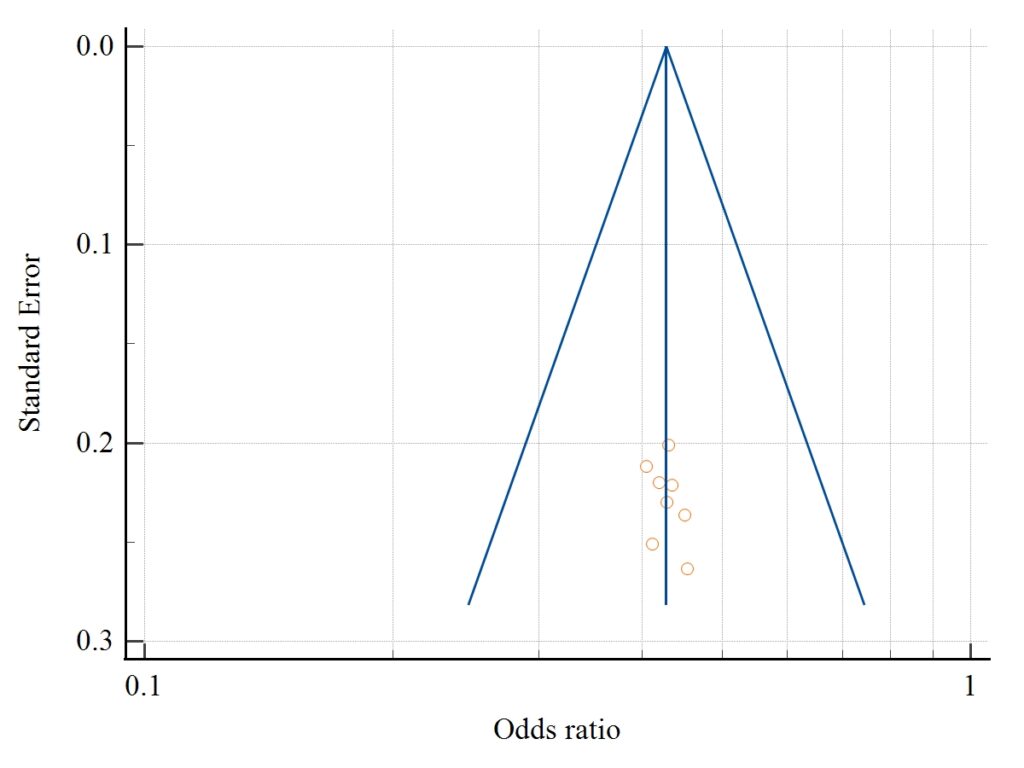
Funnel Plot Interpretation
The Funnel Plot points appear approximately symmetrical around the pooled Odds Ratio.
This suggests:
- Minimal publication bias
- No major small-study effects
- Reliable pooled estimate
Supporting evidence:
- Egger’s Test P = 0.3502
- Begg’s Test P = 0.3223
Both are non-significant.
Advantages of Odds Ratio Meta-Analysis
- Combines multiple studies
- Increases statistical power
- Improves precision
- Detects overall treatment effects
- Supports evidence-based medicine
Conclusion
Meta-Analysis Odds Ratio is one of the most important methods used in evidence-based medicine and systematic reviews. MedCalc makes the process straightforward by providing automated calculations, Forest Plots, Funnel Plots, heterogeneity testing, and publication bias assessment.
In this example, the pooled Odds Ratio was 0.428 (95% CI: 0.366–0.501, P < 0.001), indicating that the intervention significantly reduced the odds of the outcome compared with the control group. The heterogeneity analysis showed I² = 0%, confirming excellent consistency across studies, while Egger’s and Begg’s tests suggested no publication bias. These findings demonstrate how MedCalc can be used to perform reliable and publication-ready Odds Ratio Meta-Analysis in biomedical research.



