
Introduction
Multivariate datasets are common in biological, environmental, and ecological research. When several variables are measured simultaneously, understanding relationships between variables and samples becomes challenging. Principal Component Analysis (PCA) is one of the most powerful and widely used ordination techniques to simplify such complex datasets.
Principal Component Analysis (PCA) reduces large datasets into fewer meaningful dimensions while preserving most of the original information. PCA helps researchers:
- Detect patterns and gradients
- Identify correlated variables
- Visualize similarities and differences among samples
What is Principal Component Analysis (PCA)?
Principal Component Analysis is a dimension-reduction technique that transforms a set of correlated variables into a new set of uncorrelated variables, called principal components (PCs).
Each principal component:
- Is a linear combination of original variables
- Explains a certain percentage of total variance
- Is orthogonal (independent) to other components
Key Objectives of PCA
- Reduce dimensionality
- Summarize data patterns
- Visualize multivariate relationships
- Identify dominant environmental gradients
Why Use PCA in Multivariate Analysis?
PCA is widely applied because it:
- Handles large datasets efficiently
- Reveals hidden structure in data
- Minimizes noise and redundancy
- Simplifies interpretation
In environmental studies, PCA is often used to analyze:
- Water quality parameters
- Soil physicochemical variables
- Ecological community data
- Climate and pollution indicators
Why OriginPro for PCA?
OriginPro provides a user-friendly interface and advanced graphical tools for multivariate analysis.
Advantages of PCA in OriginPro
- No coding required
- High-quality publication-ready plots
- Easy interpretation of eigenvalues and loadings
- Customizable biplots and ordination diagrams
OriginPro is ideal for beginners as well as advanced researchers who want accurate PCA results without programming.
Dataset Description
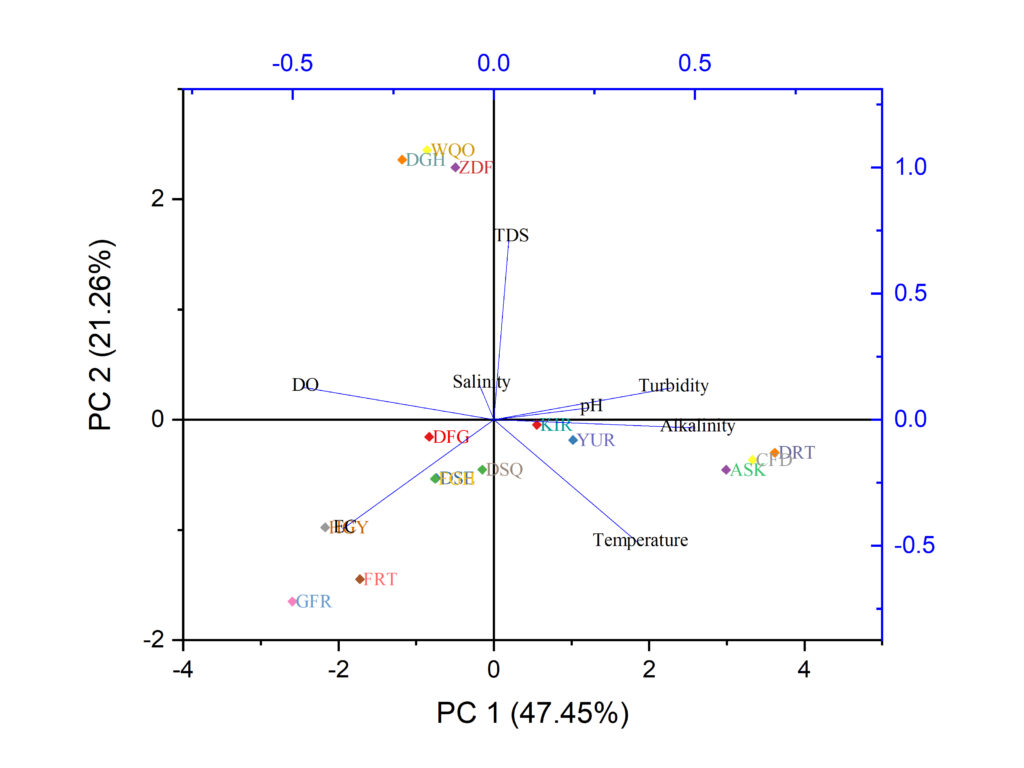
The PCA ordination plot shown in this article is based on environmental water quality parameters, including:
| Parameter | Description |
|---|---|
| pH | Acidity or alkalinity |
| Temperature | Water temperature |
| Dissolved Oxygen (DO) | Oxygen availability |
| Turbidity | Water clarity |
| Total Dissolved Solids (TDS) | Salinity indicator |
| Alkalinity | Buffering capacity |
| Salinity | Salt concentration |
Sampling stations (e.g., DRT, ASK, YUR, GFR, FRT, etc.) represent different locations or conditions.
Dataset Download
Steps to Perform PCA in OriginPro 2022
Step 1: Import Data
- Open OriginPro 2022
- Import Excel or CSV dataset
- Ensure variables are in columns and samples in rows
Step 2: Standardize the Data
- Go to Statistics → Multivariate Analysis → PCA
- Select Correlation Matrix (recommended for environmental data)
Step 3: Run PCA
- Choose variables
- Set scaling options
- Click OK
Step 4: Generate PCA Biplot
- Select Scores + Loadings (Biplot)
- Customize axes, labels, and colors
Interpretation of PCA Ordination Plot
Understanding PCA Axes
- PC1 (47.45%) explains the maximum variation
- PC2 (21.26%) explains the second-largest variation
- Together, PC1 and PC2 explain 68.71% of total variance
This indicates a strong representation of the dataset in two dimensions.
Interpretation of Variables (Loadings)
- pH, Turbidity, Alkalinity, Temperature show strong positive loading on PC1
- DO is negatively correlated with PC1
- TDS and Salinity are associated with PC2
Variables pointing in the same direction are positively correlated
Variables in opposite directions are negatively correlated
Interpretation of Sampling Stations (Scores)
- Stations like DRT, ASK, FBD cluster on the positive PC1 side → influenced by higher pH, alkalinity, and turbidity
- Stations like GFR, FRT, EGY appear on the negative side → associated with higher DO and lower temperature
- Central stations show moderate environmental conditions
Watch PCA in OriginPro – Step by Step
This video explains:
- PCA theory
- Data input in OriginPro
- Biplot generation
- Interpretation using real data
Advantages of PCA Ordination Analysis
- Reduces data complexity
- Highlights dominant environmental gradients
- Identifies influential variables
- Helps compare multiple sampling sites
- Supports ecological and biological interpretations
Limitations of PCA
- Assumes linear relationships
- Sensitive to outliers
- Interpretation depends on scaling
- Does not handle categorical data directly
Despite these limitations, PCA remains a first-choice multivariate tool in environmental and biological research.
Applications of PCA in Biological Sciences
- Water quality assessment
- Pollution monitoring
- Ecological niche analysis
- Community structure studies
- Climate impact analysis
Conclusion
Principal Component Analysis (PCA) in OriginPro is a powerful and accessible method for performing ordination and multivariate analysis. By reducing complex datasets into a few meaningful components, PCA helps researchers visualize patterns, detect correlations, and interpret environmental gradients effectively.
The PCA ordination plot presented in this article clearly demonstrates how environmental variables influence sampling stations and how OriginPro simplifies both analysis and visualization. Combined with high-quality graphics and an intuitive interface, OriginPro is an excellent choice for students and researchers who want reliable multivariate results without coding.
If you are working with biological, ecological, or environmental data, mastering PCA in OriginPro will significantly enhance your data interpretation skills.


