
Introduction
In medical and biological research, comparing two independent groups is a very common analytical task. Researchers often want to know whether a continuous variable—such as blood pressure, biomarker concentration, enzyme activity, or physiological measurement—differs significantly between two groups.
When the assumptions of parametric tests like the independent samples t-test are violated (especially normality), non-parametric alternatives are required. One of the most widely used non-parametric methods is the Mann–Whitney U test, also known as the Wilcoxon rank-sum test.
In this article, we explain the Mann–Whitney U test using MedCalc software, based on a real example comparing male and female systolic blood pressure (SBP). The article includes:
- Conceptual explanation of the Mann–Whitney test
- Step-by-step interpretation of MedCalc output
- Summary tables suitable for publication
- Explanation of the box-and-whisker plot
- Scientific conclusion for reporting in research articles
What Is the Mann–Whitney U Test?
The Mann–Whitney U test is a non-parametric statistical test used to compare two independent groups when:
- The outcome variable is continuous or ordinal
- The data are not normally distributed
- Sample sizes may be small
- Groups are independent (different individuals)
Key Features
- Compares medians rather than means
- Uses ranked data instead of raw values
- Robust against outliers and skewed distributions
Common Applications
- Male vs Female comparisons
- Treatment vs Control groups
- Clinical biomarkers
- Blood pressure measurements
- Hormone levels
Why Use Mann–Whitney Instead of t-Test?
| Situation | Recommended Test |
|---|---|
| Normal distribution | Independent t-test |
| Non-normal distribution | Mann–Whitney U test |
| Small sample size | Mann–Whitney U test |
| Outliers present | Mann–Whitney U test |
Dataset Description
The analysis compares systolic blood pressure (mmHg) between two independent groups:
- Group 1: Male participants
- Group 2: Female participants
Each group contains 10 independent observations.
Variables Used
- Male_Systolic_BP_mmHg
- Female_Systolic_BP_mmHg
Descriptive Statistics from MedCalc
Before interpreting the test result, descriptive statistics provide an overview of the data distribution.
Table 1. Descriptive Statistics of Systolic Blood Pressure
| Statistic | Male SBP (mmHg) | Female SBP (mmHg) |
|---|---|---|
| Sample size (n) | 10 | 10 |
| Lowest value | 135 | 125 |
| Highest value | 148 | 134 |
| Median | 141.5 | 129.5 |
| Interquartile range (IQR) | 139 – 145 | 127 – 132 |
| 95% CI for median | 138.48 – 145.53 | 126.48 – 132.53 |
Interpretation
- The median systolic blood pressure is clearly higher in males than females.
- The interquartile range shows minimal overlap between groups.
- This suggests a potential statistically significant difference.
Box-and-Whisker Plot Interpretation
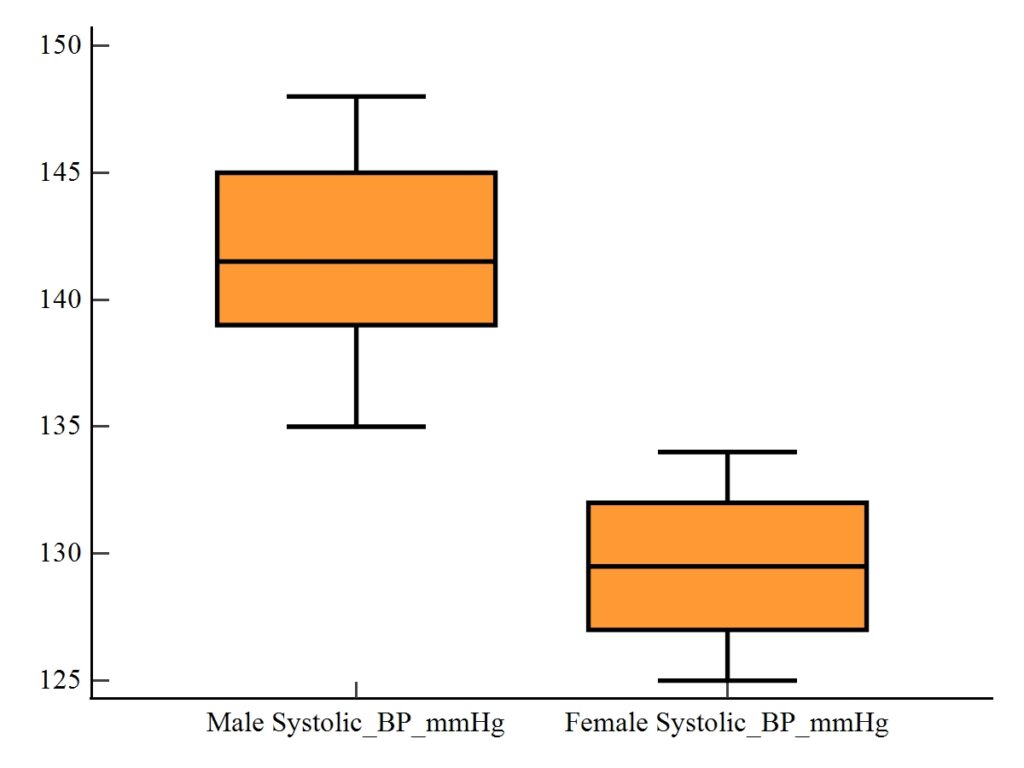
The box-and-whisker plot visually summarizes the distribution of systolic blood pressure in both groups.
How to Read the Plot
- Box: Interquartile range (Q1–Q3)
- Middle line: Median
- Whiskers: Minimum and maximum values
- Points: Individual observations
Visual Insights
- Male SBP values are consistently higher
- Female SBP values are lower and more compact
- Very little overlap between distributions
This visual evidence supports the need for a statistical comparison.
Mann–Whitney U Test Results (MedCalc Output)
MedCalc computes the Mann–Whitney U test using ranked data.
Table 2. Mann–Whitney U Test Results
| Statistic | Value |
|---|---|
| Average rank (Male) | 15.50 |
| Average rank (Female) | 5.50 |
| Mann–Whitney U | 0.0 |
| Hodges–Lehmann median difference | −12.0 |
| 95% CI of difference | −16.0 to −9.0 |
| Two-tailed P-value | P < 0.0001 |
Step-by-Step Interpretation
1. Rank Comparison
- Male group has a much higher average rank than the female group.
- This indicates higher systolic BP values in males.
2. Mann–Whitney U Statistic
- U = 0.0 is the smallest possible value, indicating complete separation of ranks.
- This is strong evidence of a difference between groups.
3. Hodges–Lehmann Median Difference
- The median systolic BP in males is approximately 12 mmHg higher than in females.
- The confidence interval does not include zero.
4. P-Value
- P < 0.0001, which is far below the conventional significance level (α = 0.05).
- The result is highly statistically significant.
Statistical Decision
- Null hypothesis (H₀): There is no difference in systolic blood pressure between males and females.
- Alternative hypothesis (H₁): There is a difference in systolic blood pressure between males and females.
Decision
✅ Reject the null hypothesis.
How to Report This Result
A Mann–Whitney U test showed that systolic blood pressure was significantly higher in males than females (median 141.5 vs 129.5 mmHg; U = 0.0, P < 0.0001).
Dataset Download
Place a download button after the Dataset Description section:
📥 Download the systolic blood pressure dataset used in this analysis
YouTube Video
🎥 Watch the full video tutorial: Mann–Whitney U Test in MedCalc
Conclusion
The Mann–Whitney U test is a powerful and reliable non-parametric method for comparing two independent groups when normality cannot be assumed. Using MedCalc, researchers can easily perform this test and obtain publication-ready statistics and visualizations.
In this analysis, systolic blood pressure was found to be significantly higher in males than females, with strong statistical evidence (P < 0.0001). The box-and-whisker plot, rank statistics, and Hodges–Lehmann estimator all consistently support this conclusion.
This example demonstrates how the Mann–Whitney U test is especially useful in clinical, biomedical, and biostatistical research, making it an essential tool for students and researchers alike.


