
Introduction
Meta-analysis is an advanced statistical technique used to combine findings from multiple independent studies. When the outcome of interest is expressed as a percentage, prevalence, incidence, or proportion, researchers use Meta-Analysis of Proportions.
This method is widely applied in biomedical research, epidemiology, public health, and clinical studies to estimate an overall pooled proportion from several studies. Examples include disease prevalence, vaccination coverage, treatment success rates, infection rates, and recovery proportions.
In this tutorial, we demonstrate how to perform Meta-Analysis Proportion in MedCalc, explain every option available in the software, interpret forest and funnel plots, and discuss the results obtained from the attached MedCalc output.
What is Meta-Analysis Proportion?
Meta-Analysis Proportion combines proportions from multiple studies to obtain an overall pooled estimate.
The proportion is calculated as:
For example:
- Disease prevalence
- Infection rate
- Treatment success rate
- Vaccination coverage
- Recovery rate
Biomedical Example
Suppose researchers investigate the prevalence of hypertension in adults across several hospitals.
Each hospital reports:
- Total participants examined
- Number diagnosed with hypertension
Meta-analysis combines these results to estimate the overall prevalence.
Example Dataset
| Study | Total Cases | Positive Cases |
|---|---|---|
| Study 1 | 200 | 70 |
| Study 2 | 180 | 60 |
| Study 3 | 250 | 95 |
| Study 4 | 220 | 80 |
| Study 5 | 300 | 120 |
| Study 6 | 280 | 105 |
| Study 7 | 240 | 88 |
| Study 8 | 260 | 98 |
📥 Download Dataset
Download the Excel dataset used in this tutorial:
Understanding the Variables
Study
Represents the study identifier.
Examples:
- Hospital A
- Hospital B
- Clinical Trial 1
Total Cases
Total number of participants included in the study.
Example:
200 participants examined.
Positive Cases
Number of participants showing the condition of interest.
Example:
70 participants diagnosed with hypertension.
How Proportion is Calculated
For Study 1:
Positive Cases = 70
Total Cases = 200
Calculation:
70 ÷ 200 = 0.35
Percentage:
35%
For Study 5:
120 ÷ 300 = 0.40
Percentage:
40%
These percentages become the effect sizes used in the meta-analysis.
Step-by-Step Meta-Analysis Proportion in MedCalc
Step 1: Open MedCalc
Navigate to:
Statistics → Meta-analysis → Proportion
Step 2: Select Variables
Studies
Select:
Study
Total Number of Cases
Select:
Total_Cases
Number of Positive Cases
Select:
Positive_Cases
Step 3: Configure Options
Choose:
✔ Forest Plot
✔ Random Effect Model Weights
✔ Plot Pooled Effect – Random Effects Model
✔ Diamonds for Pooled Effects
✔ Funnel Plot
Step 4: Run Analysis
Click:
OK
MedCalc will generate:
- Forest plot
- Funnel plot
- Pooled prevalence estimate
- Heterogeneity statistics
- Publication bias tests
Explanation of MedCalc Options
Forest Plot
The forest plot visually summarizes all studies.
It displays:
- Individual study proportions
- Confidence intervals
- Overall pooled estimate
Recommended:
✔ Enabled
Marker Size Relative to Study Weight
The square size reflects study importance.
Larger sample sizes receive larger weights.
Fixed Effect Model Weights
Assumes:
All studies estimate exactly the same underlying proportion.
Suitable when heterogeneity is negligible.
Random Effect Model Weights
Assumes:
The true proportion varies between studies.
Most biomedical meta-analyses use this approach.
Recommended:
✔ Enabled
Plot Pooled Effect – Fixed Effects
Displays pooled estimate using fixed effect assumptions.
Optional.
Plot Pooled Effect – Random Effects
Displays pooled estimate using random effects assumptions.
Recommended:
✔ Enabled
Diamonds for Pooled Effects
The diamond shape represents:
- Overall pooled proportion
- Confidence interval
Recommended:
✔ Enabled
Funnel Plot
Evaluates:
- Publication bias
- Small study effects
Recommended:
✔ Enabled
Results Interpretation
According to the MedCalc output, eight studies were included with a combined sample size of 1,930 participants.
Individual Study Results
| Study | Sample Size | Proportion (%) | Interpretation |
|---|---|---|---|
| Study 1 | 200 | 35.0 | Moderate prevalence |
| Study 2 | 180 | 33.3 | Moderate prevalence |
| Study 3 | 250 | 38.0 | High prevalence |
| Study 4 | 220 | 36.4 | Moderate prevalence |
| Study 5 | 300 | 40.0 | Highest prevalence |
| Study 6 | 280 | 37.5 | High prevalence |
| Study 7 | 240 | 36.7 | Moderate prevalence |
| Study 8 | 260 | 37.7 | High prevalence |
These results indicate prevalence values ranging from approximately 33% to 40%.
Pooled Proportion Result
Fixed Effects Model
- Pooled proportion = 37.142%
- 95% CI = 34.986% to 39.338%
Random Effects Model
- Pooled proportion = 37.142%
- 95% CI = 35.005% to 39.306%
Interpretation:
Approximately 37% of participants across all studies were positive for hypertension.
Forest Plot Interpretation
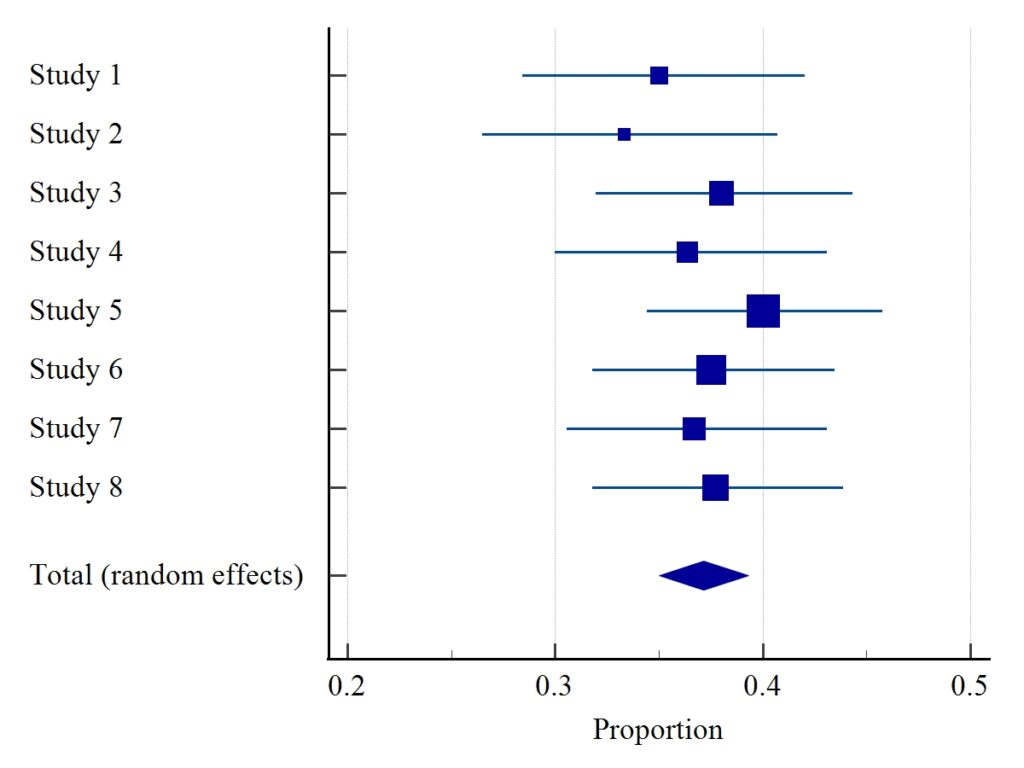
- Squares = study estimates
- Horizontal lines = confidence intervals
- Diamond = pooled estimate
The diamond is centered near 37%, indicating the overall pooled prevalence.
Because most confidence intervals overlap substantially, study results appear highly consistent.
Test for Heterogeneity
MedCalc reported:
| Statistic | Value |
|---|---|
| Q | 2.7445 |
| Degrees of Freedom | 7 |
| P-value | 0.9076 |
| I² | 0.00% |
Interpretation
Q Test
P = 0.9076
Since:
P > 0.05
There is no significant heterogeneity.
I² Statistic
I² = 0%
Interpretation:
- 0–25% = Low heterogeneity
- 25–50% = Moderate heterogeneity
- 50–75% = Substantial heterogeneity
- 75% = High heterogeneity
Result:
✔ Very low heterogeneity
✔ Studies are highly consistent
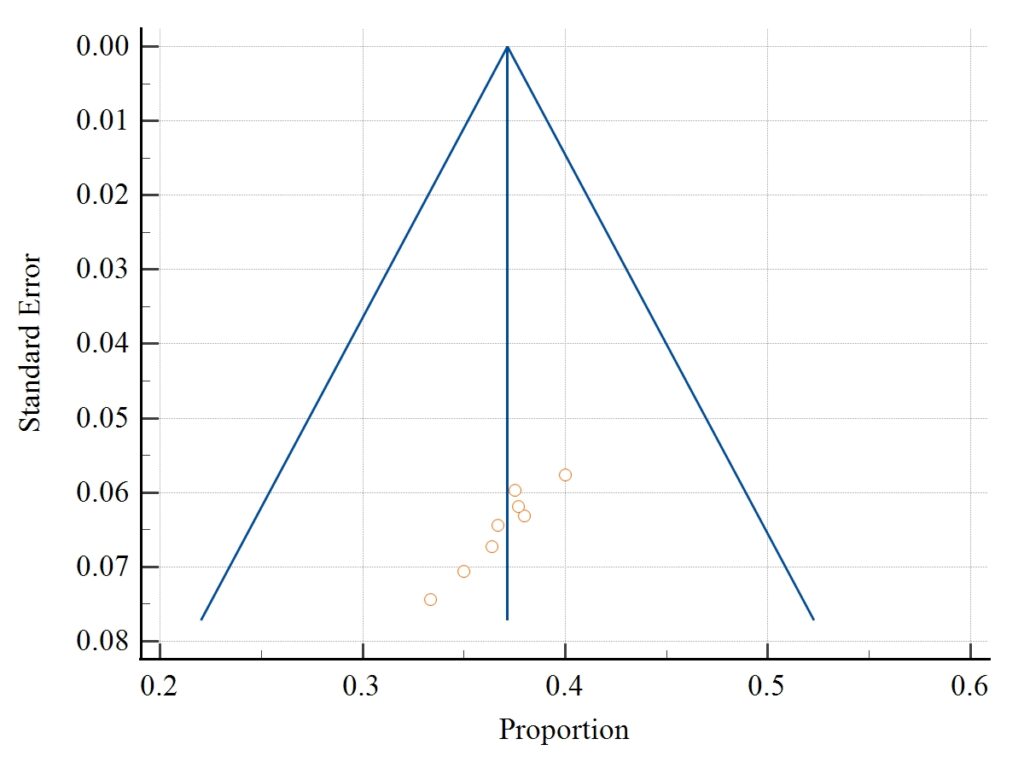
Funnel Plot Interpretation
The funnel plot assesses publication bias.
In an ideal situation:
- Studies form a symmetrical funnel shape
- No publication bias is present
Publication Bias Assessment
Egger’s Test
- Intercept = -7.0929
- P = 0.0003
Begg’s Test
- Kendall’s Tau = -0.7857
- P = 0.0065
Both tests are statistically significant.
Interpretation of Publication Bias
Because:
- Egger’s test P < 0.05
- Begg’s test P < 0.05
There may be publication bias.
Possible explanation:
- Smaller studies with lower prevalence estimates may not have been published.
- Positive findings may be overrepresented.
Researchers should interpret pooled results with caution.
Advantages of Meta-Analysis Proportion
✔ Combines evidence from multiple studies
✔ Increases statistical power
✔ Provides precise prevalence estimates
✔ Improves clinical decision-making
✔ Supports evidence-based medicine
Applications in Biomedical Research
Meta-analysis proportion is commonly used for:
- Disease prevalence studies
- Vaccine effectiveness research
- Infection rate estimation
- Treatment success evaluation
- Public health surveillance
- Epidemiological investigations
Conclusion
Meta-Analysis Proportion in MedCalc is an effective statistical approach for combining prevalence and proportion data from multiple studies. In this tutorial, we learned how to prepare data, configure MedCalc options, interpret forest and funnel plots, evaluate heterogeneity, and assess publication bias.
The analysis demonstrated an overall pooled prevalence of approximately 37.1%, with virtually no heterogeneity among studies (I² = 0%). Although the pooled estimate was highly consistent, publication bias tests suggested potential reporting bias that should be considered when interpreting the findings.
This method is widely used in epidemiology, clinical research, and public health because it provides a reliable summary estimate from multiple studies and strengthens evidence-based conclusions.


