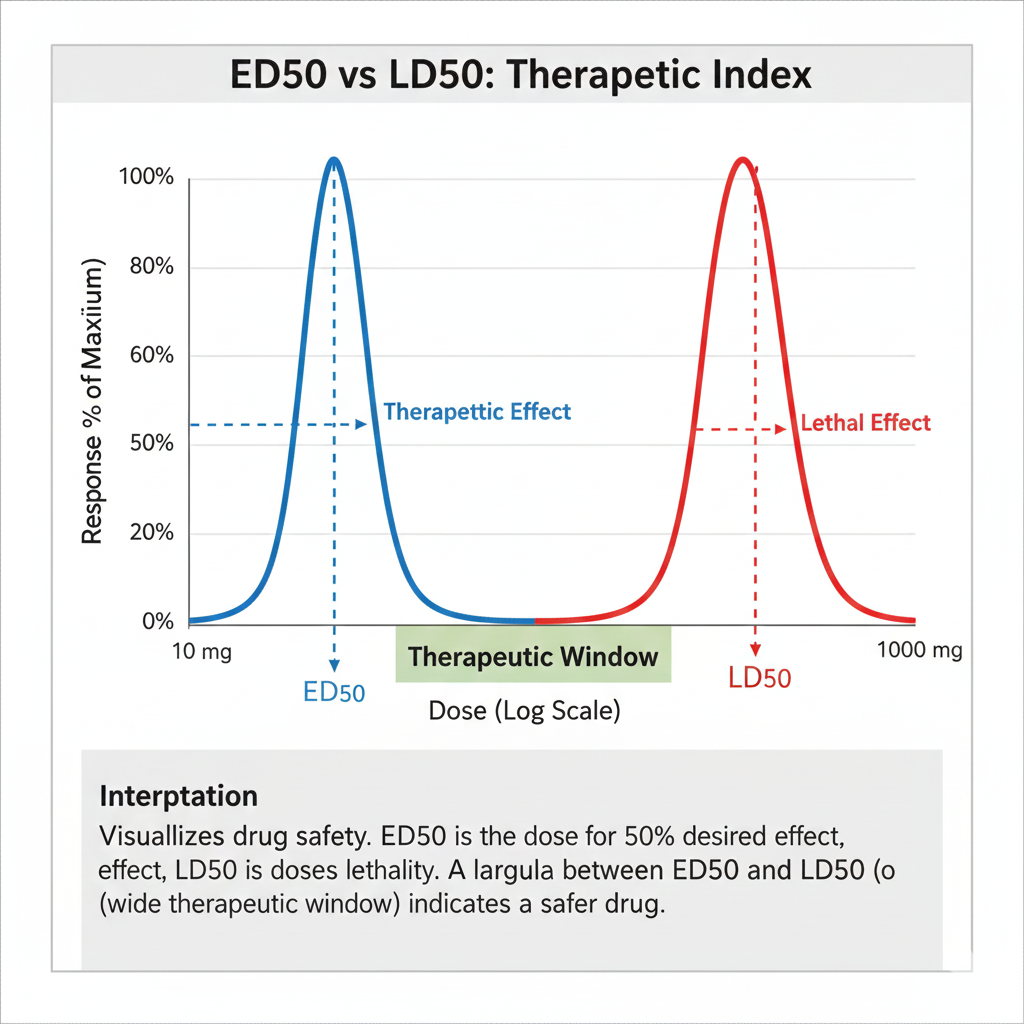
Dose–response studies are fundamental in pharmacology, toxicology, and biological sciences. They help researchers understand how organisms respond to increasing levels of a drug, chemical, toxin, or environmental factor. Two of the most widely used indicators in these studies are ED50 (Effective Dose 50%) and LD50 (Lethal Dose 50%). These metrics provide essential information about drug potency, safety, toxicity, and biological risk assessment.
In this comprehensive article, we explore what ED50 and LD50 mean, how they are calculated, how they differ, and why they are crucial in biological and pharmaceutical research. We also explain how dose–response curves, including sigmoid (S-shaped) curves, are used to estimate these values using tools such as Probit or Logit regression.
Introduction
Understanding the effect of chemical or biological agents on an organism is key to both medicine and toxicology. When scientists expose living systems to varying doses of a substance, the outcomes provide insights into real-world safety levels, hazard thresholds, and therapeutic effectiveness. These experiments allow researchers to predict how much of a drug will produce the desired effect — or how much of a toxin can become harmful.
This is where ED50 (Effective Dose for 50% of the population) and LD50 (Lethal Dose for 50% of the population) play critical roles. These standardized benchmarks help in comparing substances, determining risk, guiding dosage recommendations, and establishing safety regulations.
Whether you are a biostatistics student, agricultural researcher, toxicologist, or pharmacology professional, understanding ED50 and LD50 is essential. This article offers a clear scientific explanation suitable for academic writing, professional use, and educational content creation.
What Is ED50?
ED50, or Effective Dose 50%, refers to the dose of a substance required to produce a biological or therapeutic effect in 50% of the tested population.
Put simply:
➡️ ED50 = Dose at which 50% of subjects show the expected effect.
Examples of ED50 applications:
- The drug dose required for pain relief in 50% of patients
- The concentration of a chemical that triggers enzyme activity in 50% of cells
- The amount of pesticide needed to control 50% of a pest population
- The drug quantity that produces a behavioral or physiological response in half of the test animals
Why ED50 Matters
ED50 is commonly used to compare the potency of drugs:
- A lower ED50 indicates a more potent drug (small dose gives high effect)
- A higher ED50 suggests lower potency
In drug development, ED50 helps determine:
- Therapeutic dose ranges
- Dose adjustments
- Initial clinical trial dosing
- Comparisons between alternative drugs
What Is LD50?
LD50, or Lethal Dose 50%, indicates the amount of a substance required to kill 50% of the test population (typically laboratory animals).
In simple words:
➡️ LD50 = Dose at which 50% of test animals die from exposure.
LD50 is primarily used in toxicology, environmental health, and chemical safety.
Applications of LD50:
- Measuring acute toxicity of chemicals
- Assessing environmental pollutants
- Determining pesticide toxicity
- Setting safety regulations
- Labeling required by international chemical hazard standards
How LD50 Is Interpreted
- Low LD50 = highly toxic substance
- High LD50 = less toxic substance
For example:
| Substance | LD50 (mg/kg, oral rat) | Toxicity Category |
|---|---|---|
| Nicotine | 1 | Extremely toxic |
| Caffeine | 192 | Moderately toxic |
| Table salt (NaCl) | 3000 | Low toxicity |
This demonstrates that toxicity varies widely, and LD50 is a standardized measure to compare hazards.
Table: Difference Between ED50 and LD50
| Feature | ED50 | LD50 |
|---|---|---|
| Meaning | Effective dose for 50% response | Lethal dose for 50% mortality |
| Used in | Pharmacology, physiology | Toxicology, environmental safety |
| Outcome | Therapeutic/effective effect | Death or severe toxic effect |
| Lower value means | Higher efficacy | Higher toxicity |
| Estimation method | Dose–response curve | Dose–mortality curve |
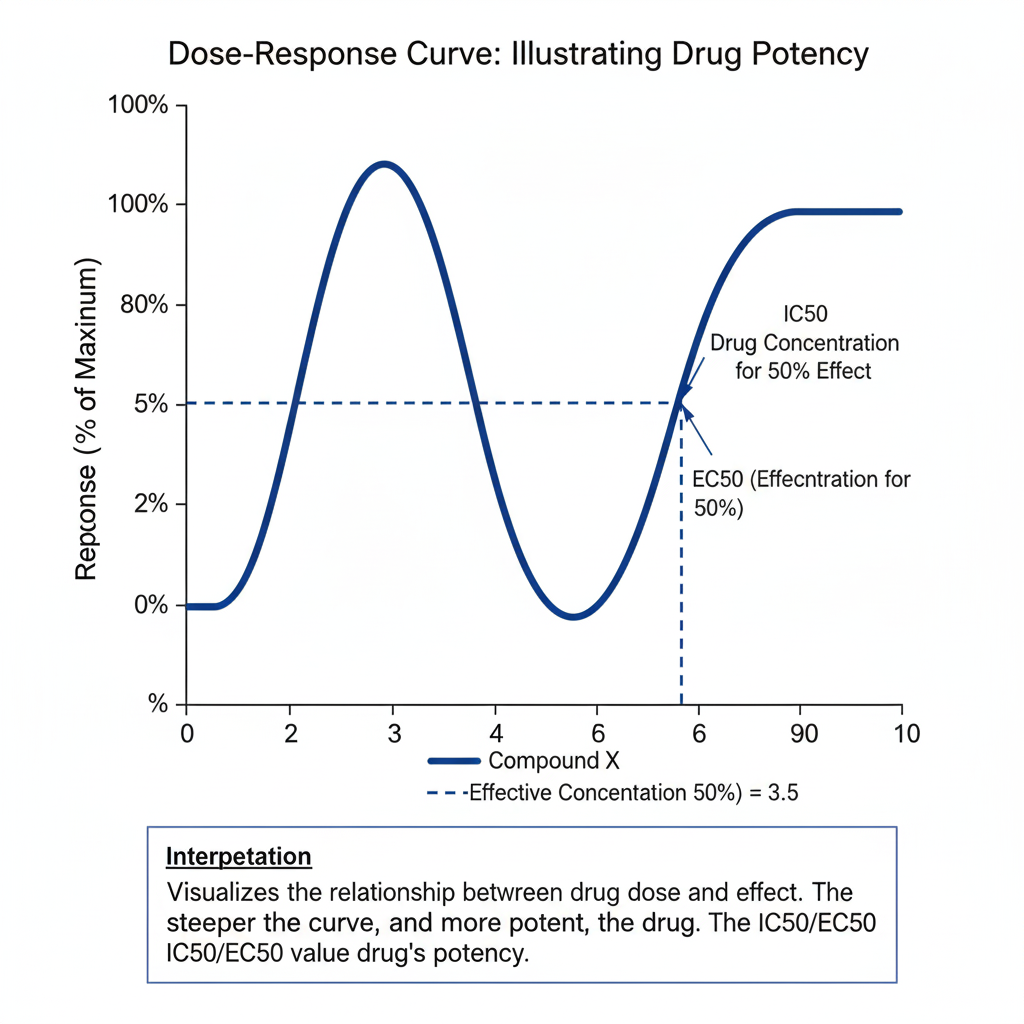
The Science Behind Dose–Response Curves
To calculate ED50 or LD50, scientists use dose–response models, where increasing doses of a substance are tested and the biological responses are recorded.
Typically, this curve has a sigmoid (S-shaped) shape:
- Low doses: little or no effect
- Moderate doses: steep increase in response
- High doses: response plateaus near 100%
The curve helps determine:
- Threshold dose
- ED10, ED25, ED50, ED90 values
- Maximum effect
- Toxicity levels
Tools such as Probit regression, Logit models, or nonlinear logistic models are used.
How ED50 and LD50 Are Calculated (Scientific Explanation)
1. Collect Dose and Response Data
For example:
- Dose levels: 0 mg, 1 mg, 2 mg, 3 mg, etc.
- Responses: 0 = No effect / survival; 1 = Effect / death
2. Model the Relationship
The most common methods:
- Probit Regression (popular in toxicology)
- Logit Regression
- Nonlinear logistic models
3. Fit the Sigmoid Curve
The model estimates the dose corresponding to:
- 10% response (ED10)
- 25% response (ED25)
- 50% response (ED50)
- 90% response (ED90)
4. Identify ED50 or LD50
Using mathematical transformation, the model computes the dose at which predicted response probability = 0.5.
Why ED50 and LD50 Are Essential in Biological Research
1. Safety and Risk Assessment
LD50 helps determine safe handling limits of chemicals.
2. Drug Potency Comparison
ED50 allows pharmaceutical companies to compare drug strengths.
3. Environmental Toxicity
regulatory agencies use LD50 to classify pollutants.
4. Clinical Dose Selection
ED50 helps identify therapeutic windows.
5. Agricultural Decision-Making
ED50 and LD50 guide pesticide usage levels.
Practical Example Using Probit Regression
To illustrate ED50 estimation, consider a dose–response study where 50 animals are exposed to different drug doses.
From a Probit regression output (like the one you uploaded earlier):
- ED50 = 3.31 mg
- 95% CI: 2.38 to 4.18 mg
Interpretation:
- At 3.31 mg, 50% of animals show the effect
- The steep slope indicates consistent biological response
- A narrow CI means the estimate is precise
This type of analysis is commonly done in MedCalc, R, SPSS, GraphPad Prism, and Python.
Ethical Considerations for LD50 Experiments
Modern alternatives reduce animal usage:
- Cell culture assays
- Computer-based modeling
- Up-and-down methods
- In vitro toxicity prediction
Many countries discourage LD50 tests unless absolutely necessary.
Conclusion
ED50 and LD50 are two of the most important metrics in pharmacology and toxicology. ED50 helps determine the effective dose of a therapeutic agent, while LD50 helps define toxicity and establish safety guidelines. Both indicators are calculated using dose–response models such as Probit regression and are essential for comparing substances, determining potency, and ensuring public and environmental safety.
With a strong understanding of dose–response relationships, researchers can make informed decisions about drug development, chemical safety, environmental testing, and biological risk assessment.
These metrics continue to play a central role in modern biological and medical research, even as new ethical and computational methods emerge to complement traditional experimental approaches.