Introduction
Diagnostic tests play an important role in biomedical research, clinical laboratories, and healthcare. Researchers need to determine whether a laboratory marker or clinical measurement can distinguish patients who have a particular disease from those who do not. Receiver Operating Characteristic (ROC) curve analysis is a widely used statistical method for evaluating this ability.
ROC curve analysis examines diagnostic performance across different threshold values. It helps researchers understand the relationship between sensitivity and specificity and estimate the Area Under the Curve (AUC). It can also help identify a potential cut-off value for classifying test results as positive or negative.
MedCalc provides ROC curve analysis with options for AUC estimation, confidence intervals, criterion values, the Youden index, likelihood ratios, and graphical presentation. These results are useful when evaluating diagnostic biomarkers and laboratory tests.
This article explains ROC curve analysis using a simulated C-reactive protein (CRP) dataset and interprets the actual results in the supplied MedCalc report.
What Is a ROC Curve?
ROC stands for Receiver Operating Characteristic. A ROC curve is a graph used to evaluate the ability of a diagnostic test to distinguish between two groups, usually disease-positive and disease-negative individuals.
The horizontal axis represents the false-positive rate, calculated as 100 minus specificity when percentages are used. The vertical axis represents sensitivity.
Sensitivity is the proportion of people with the disease who test positive. Specificity is the proportion of people without the disease who test negative.
A ROC curve is constructed by examining different thresholds of the test variable. Changing the threshold changes the balance between sensitivity and specificity. A lower threshold may identify more disease-positive individuals but can also increase false positives. A higher threshold may improve specificity while missing more true cases.
The AUC summarizes the test’s overall ability to distinguish the two groups. An AUC of 0.5 indicates chance-level discrimination, whereas an AUC of 1.0 indicates perfect discrimination. The AUC can also be interpreted as the probability that a randomly selected disease-positive individual receives a more disease-indicative test result than a randomly selected disease-negative individual, subject to the usual assumptions of ROC analysis.
Biomedical Example: CRP and Bacterial Infection
Consider a simulated biomedical study evaluating C-reactive protein (CRP) as a potential marker for distinguishing patients with bacterial infection from those without bacterial infection.
The dataset contains 30 simulated patients. Disease status is coded as 0 for the negative group and 1 for the positive group. CRP concentration is recorded in milligrams per litre (mg/L).
The variables are:
- Patient_ID: Unique patient identifier.
- Disease_Status: Reference classification, where 0 indicates no bacterial infection and 1 indicates bacterial infection.
- CRP_mg_L: CRP concentration in mg/L.
The reference diagnosis should be determined independently of the test being evaluated. This is important because ROC analysis assesses the test’s ability to distinguish groups defined by an independent classification.
Simulated biomedical dataset
| Patient_ID | Disease_Status | CRP_mg_L |
|---|---|---|
| 1 | 0 | 3 |
| 2 | 0 | 5 |
| 3 | 0 | 7 |
| 4 | 0 | 8 |
| 5 | 0 | 10 |
| 6 | 0 | 11 |
| 7 | 0 | 12 |
| 8 | 0 | 14 |
| 9 | 0 | 15 |
| 10 | 0 | 16 |
| 11 | 0 | 18 |
| 12 | 0 | 20 |
| 13 | 0 | 22 |
| 14 | 0 | 24 |
| 15 | 0 | 28 |
| 16 | 1 | 18 |
| 17 | 1 | 22 |
| 18 | 1 | 25 |
| 19 | 1 | 28 |
| 20 | 1 | 30 |
| 21 | 1 | 32 |
| 22 | 1 | 35 |
| 23 | 1 | 38 |
| 24 | 1 | 40 |
| 25 | 1 | 42 |
| 26 | 1 | 45 |
| 27 | 1 | 48 |
| 28 | 1 | 52 |
| 29 | 1 | 58 |
| 30 | 1 | 65 |
Download Episode 68 ROC Curve Analysis dataset
Note: The dataset is simulated for educational purposes and should not be used for clinical decision-making.
Results and Interpretation
The supplied MedCalc report includes the sample size, AUC, standard error, 95% confidence interval, z statistic, significance level, Youden index, associated criterion, sensitivity, specificity, and criterion-specific diagnostic characteristics.
Table 1. Sample size and group distribution
| Parameter | Result |
|---|---|
| Total sample size | 30 |
| Positive group (Disease_Status = 1) | 15 (50.00%) |
| Negative group (Disease_Status = 0) | 15 (50.00%) |
| Disease prevalence | Unknown |
Explanation of Table 1: The analysis included 30 observations, with 15 in each diagnostic group. The equal group sizes describe this simulated dataset, but they should not be interpreted as the actual prevalence of bacterial infection in a clinical population. The report explicitly identifies disease prevalence as unknown.
This distinction matters because predictive values depend on prevalence. Sensitivity, specificity, and the ROC curve assess discrimination, whereas the probability that a positive or negative test result correctly predicts disease status also depends on the underlying population.
Table 2. Area under the ROC curve
| Statistic | MedCalc result |
|---|---|
| Area under the ROC curve (AUC) | 0.962 |
| Standard error | 0.0283 |
| 95% confidence interval | 0.821–0.999 |
| z statistic | 16.328 |
| Significance level, testing AUC = 0 | Not applicable |
| Significance level, testing AUC = 0.5 | P < 0.0001 |
Explanation of Table 2: The AUC of 0.962 indicates excellent discrimination in this simulated example. It suggests that CRP values generally distinguish the disease-positive group from the disease-negative group.
The 95% confidence interval extends from 0.821 to 0.999. Although the interval indicates strong estimated discrimination, it is relatively wide, reflecting uncertainty in the estimate. The sample contains only 30 observations, so the results should be treated as an educational illustration rather than a reliable estimate of clinical performance.
The reported significance level is below 0.0001 for the null hypothesis that the population AUC equals 0.5. This provides evidence that the observed discrimination is greater than chance level under the analysis assumptions. Statistical significance alone does not establish clinical usefulness or prove that CRP is suitable as a stand-alone diagnostic test.
Table 3. Youden index and selected criterion
| Parameter | MedCalc result |
|---|---|
| Youden index (J) | 0.8000 |
| Associated criterion | >24 |
| Sensitivity | 86.67% |
| Specificity | 93.33% |
Explanation of Table 3: The Youden index combines sensitivity and specificity into one measure. Its value ranges from 0 to 1, with higher values indicating a better combination of sensitivity and specificity at the selected threshold.
For this analysis, the associated criterion is greater than 24. At this criterion, sensitivity is 86.67%, meaning that approximately 86.67% of disease-positive observations are correctly identified. Specificity is 93.33%, meaning that approximately 93.33% of disease-negative observations are correctly classified as negative.
The Youden index is calculated from sensitivity and specificity expressed as proportions:
J = Sensitivity + Specificity − 1
For the reported values, J = 0.8667 + 0.9333 − 1 = 0.8000.
This criterion provides a useful summary of the sensitivity-specificity trade-off. However, the Youden criterion is not automatically the best clinical threshold in every setting. The appropriate threshold depends on the consequences of false-positive and false-negative results, the purpose of testing, and clinical context.
Table 4. Selected criterion values and diagnostic characteristics
| Criterion | Sensitivity (%) | Specificity (%) | Positive likelihood ratio (+LR) | Negative likelihood ratio (−LR) |
|---|---|---|---|---|
| ≥3 | 100.00 | 0.00 | 1.00 | Not reported |
| >16 | 100.00 | 66.67 | 3.00 | 0.00 |
| >18 | 93.33 | 73.33 | 3.50 | 0.091 |
| >20 | 93.33 | 80.00 | 4.67 | 0.083 |
| >22 | 86.67 | 86.67 | 6.50 | 0.15 |
| >24 | 86.67 | 93.33 | 13.00 | 0.14 |
| >25 | 80.00 | 93.33 | 12.00 | 0.21 |
| >28 | 73.33 | 100.00 | Not reported | 0.27 |
| >65 | 0.00 | 100.00 | Not reported | 1.00 |
Explanation of Table 4: The table illustrates how the threshold changes diagnostic performance. At lower thresholds, sensitivity may be high, but specificity can be poor because more disease-negative individuals test positive. As the threshold rises, specificity generally increases, while sensitivity may decrease.
At the reported criterion of >24, sensitivity is 86.67% and specificity is 93.33%. The positive likelihood ratio of 13 indicates that a positive result is substantially more likely among disease-positive than disease-negative observations under this simulated dataset. Likelihood ratios should be interpreted alongside clinical context and uncertainty; they do not directly provide the probability of disease.
At a criterion of >28, specificity reaches 100%, but sensitivity decreases to 73.33%. This illustrates the trade-off: a threshold that minimizes false positives can miss a larger proportion of disease-positive cases.
The displayed rows are selected from the MedCalc criterion table. They are not a replacement for the complete report when all thresholds are required.
Interpretation of the ROC Plot
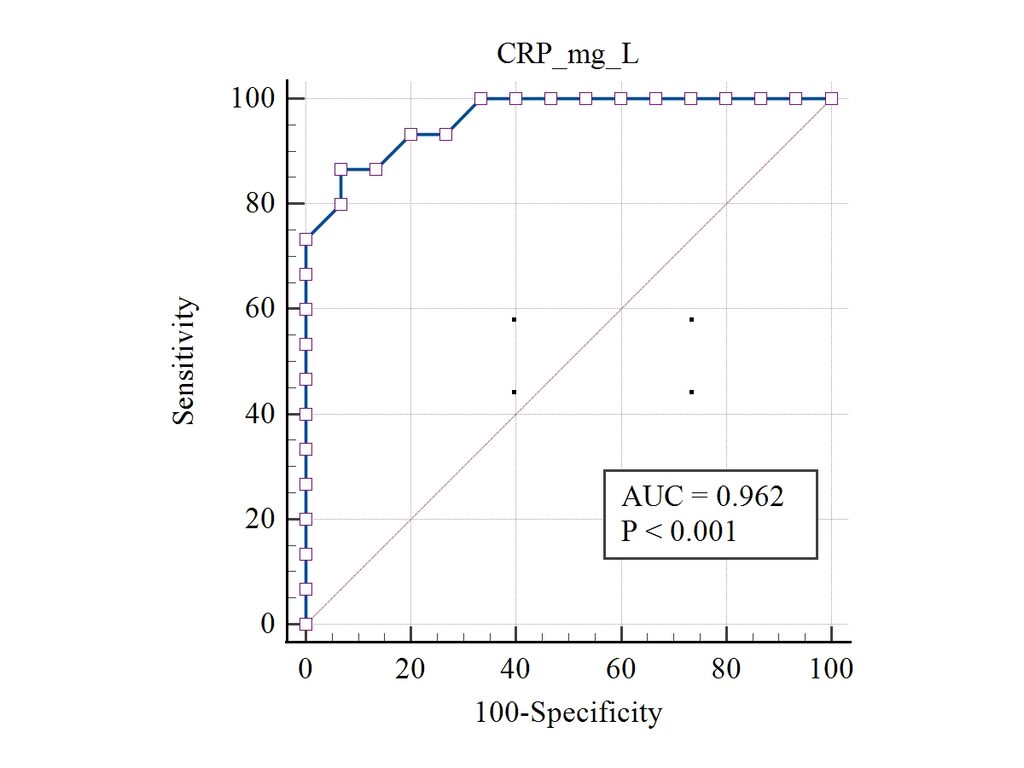
The graph places CRP_mg_L as the test variable. The horizontal axis is labelled 100-Specificity and the vertical axis is labelled Sensitivity. Each point represents a sensitivity and false-positive-rate combination associated with a criterion value.
The blue ROC curve rises toward the upper-left region and stays well above the diagonal reference line. This pattern is consistent with strong discrimination between the positive and negative groups. The diagonal line represents chance-level discrimination.
The graph annotation shows AUC = 0.962 and P < 0.001. The detailed MedCalc report gives the more precise significance result P < 0.0001. For reporting, use the exact value from the numerical report and keep the graph annotation consistent with it if you update the figure.
Limitations and Clinical Considerations
ROC analysis evaluates discrimination, but it does not by itself demonstrate that a test improves patient outcomes or provides a clinically useful decision. A small simulated dataset can produce an impressive AUC while still giving imprecise estimates of sensitivity and specificity.
The selected criterion should be validated in an appropriate independent population before being applied in clinical practice. Researchers should also consider disease prevalence, the consequences of false-positive and false-negative classifications, and whether the test adds useful information beyond existing diagnostic procedures.
The equal group sizes in this dataset do not reflect a known real-world prevalence. Therefore, predictive values should not be inferred from this sample without appropriate prevalence information.
Conclusion
ROC curve analysis is an important statistical method for evaluating diagnostic test performance in biomedical research. In the supplied MedCalc report, the CRP variable achieved an AUC of 0.962, with a 95% confidence interval of 0.821–0.999 and a significance level below 0.0001 for comparison with an AUC of 0.5.
The Youden index was 0.8000 at the criterion >24, where sensitivity was 86.67% and specificity was 93.33%. The ROC plot supports the numerical finding of strong discrimination in this simulated example.
These results illustrate how the AUC, confidence interval, Youden index, criterion values, sensitivity, specificity, and likelihood ratios can be interpreted together. Clinical use requires validation with appropriate patient populations and consideration of the consequences of diagnostic decisions.