Introduction
Inter-rater agreement is an important statistical method used to determine the consistency of assessments made by two or more independent observers. In biomedical research, clinical studies, diagnostic investigations, and biological sciences, researchers frequently depend on human observations to classify samples, evaluate disease severity, or assign categorical scores.
However, different observers may interpret the same sample differently because of variations in professional experience, judgment, or assessment criteria. Therefore, evaluating agreement between observers is essential for ensuring the reliability and reproducibility of research findings.
The Kappa statistic is a widely used method for measuring agreement between observers while accounting for the agreement that may occur by chance. Unlike simple percentage agreement, Kappa provides a statistical measure of agreement beyond chance.
In this tutorial, we demonstrate how to perform Inter-rater Agreement (Kappa) analysis in MedCalc Statistical Software using an example involving two dermatologists who independently classified 30 observations into four severity categories: Mild, Moderate, Severe, and Very Severe.
The analysis uses Weighted Kappa with linear weights to assess the degree of agreement between the two dermatologists. The results include a contingency table, weighted Kappa coefficient, standard error, 95% confidence interval, and graphical representation.
This tutorial explains the statistical concepts, analysis procedure, output interpretation, and reporting format for students, researchers, and healthcare professionals.
What Is Inter-rater Agreement?
Inter-rater agreement refers to the degree of consistency between two or more observers who independently assess the same subjects or samples using a common classification system.
For example, two dermatologists may independently evaluate the severity of a skin condition and classify each patient as Mild, Moderate, Severe, or Very Severe.
If both dermatologists assign the same category to a patient, their assessments demonstrate exact agreement. If they assign different categories, disagreement occurs.
Inter-rater agreement analysis helps researchers determine whether the observed consistency between raters is greater than what would be expected by chance.
Applications of Inter-rater Agreement
Inter-rater agreement is commonly applied in:
- Clinical diagnosis and disease severity assessment.
- Radiological image interpretation.
- Histopathological classification.
- Biological sample identification.
- Educational assessment and grading.
- Questionnaire and survey evaluation.
- Behavioural observation studies.
- Research involving subjective categorical measurements.
Definition of Cohen’s Kappa Statistic
Cohen’s Kappa is a statistical coefficient used to measure agreement between two independent observers who classify the same subjects into categorical groups.
The coefficient measures agreement beyond chance and is represented by the Greek letter κ (Kappa).
The mathematical formula is:
κ = (Po − Pe) / (1 − Pe)
Where:
- κ = Kappa coefficient
- Po = Observed proportion of agreement
- Pe = Expected proportion of agreement by chance
The Kappa coefficient generally ranges from −1 to +1.
A value of +1 indicates perfect agreement, 0 indicates agreement equivalent to chance, and negative values indicate agreement below chance expectations.
For ordinal categories, Weighted Kappa is often preferred because it considers the degree of disagreement between categories.
Understanding Weighted Kappa
Weighted Kappa is an extension of the conventional Kappa statistic designed for ordinal categorical data.
Ordinal categories have a meaningful order, such as:
Mild → Moderate → Severe → Very Severe
In this classification system, disagreement between Mild and Moderate is less serious than disagreement between Mild and Very Severe.
Ordinary Kappa treats disagreements between categories without considering their distance. Weighted Kappa assigns different penalties according to the magnitude of disagreement.
Linear Weights
In this example, MedCalc uses linear weights.
Linear weighting assigns progressively smaller agreement weights as the difference between categories increases.
For four ordered categories, the agreement weights are:
| Difference between categories | Weight |
|---|---|
| Exact agreement | 1.000 |
| One-category difference | 0.667 |
| Two-category difference | 0.333 |
| Three-category difference | 0.000 |
This approach makes Weighted Kappa suitable for evaluating agreement between observers who use ordered severity classifications.
Interpretation of Kappa Values
The commonly used Landis and Koch descriptive classification provides a general framework for interpreting Kappa coefficients.
| Kappa value | Interpretation |
|---|---|
| Below 0.00 | Poor agreement |
| 0.00–0.20 | Slight agreement |
| 0.21–0.40 | Fair agreement |
| 0.41–0.60 | Moderate agreement |
| 0.61–0.80 | Substantial agreement |
| 0.81–1.00 | Almost perfect agreement |
These categories are descriptive guidelines rather than universal statistical standards. Interpretation should also consider the study design, measurement method, and clinical importance of disagreement.
How to Perform Inter-rater Agreement Analysis in MedCalc
MedCalc provides a statistical procedure for evaluating agreement between observers using categorical data.
Download Sample Dataset
Step 1: Prepare the Data
The dataset contains two observer variables:
- Dermatologist 1
- Dermatologist 2
Each dermatologist independently classifies the same 30 observations into four categories.
The categories are Mild, Moderate, Severe, and Very Severe.
Step 2: Open the Kappa Analysis
Open MedCalc Statistical Software and navigate to the inter-rater agreement analysis.
Select the Inter-rater Agreement (Kappa) procedure.
Step 3: Enter the Observer Data
Enter the categorical assessments for both observers.
Each row should represent one subject or observation, with the corresponding assessment from Dermatologist 1 and Dermatologist 2.
Ensure that both variables use the same category definitions and ordering.
Step 4: Select the Weighting Method
For ordinal severity categories, select Weighted Kappa with Linear Weights.
This option accounts for the magnitude of disagreement between categories.
Step 5: Perform the Analysis
Run the analysis to obtain the contingency table and agreement statistics.
The output includes the weighted Kappa coefficient, standard error, and 95% confidence interval.
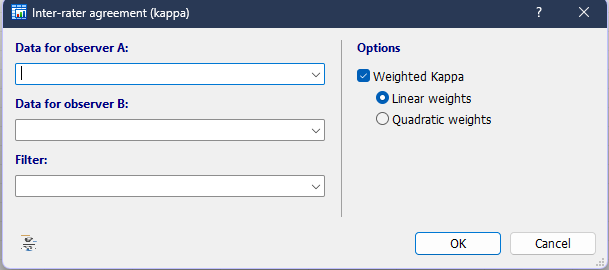
Options Explanation in Inter-rater Agreement Analysis
The important analytical components are explained below.
1. Observer A and Observer B
These represent the two independent raters whose assessments are being compared.
In this example, Observer A is Dermatologist 1 and Observer B is Dermatologist 2.
2. Categories
The categories represent the possible assessment outcomes. Here, four ordinal categories are used.
3. Weighted Kappa
This statistic measures agreement beyond chance while accounting for the seriousness of disagreements.
4. Linear Weights
Linear weights apply a proportional penalty according to the distance between categories.
5. Standard Error
The standard error measures the sampling variability associated with the estimated Kappa coefficient.
A smaller standard error generally indicates greater precision.
6. 95% Confidence Interval
The confidence interval provides a range of plausible values for the population agreement coefficient.
A confidence interval that excludes zero supports evidence of agreement beyond chance at the corresponding two-sided 5% significance level, subject to the assumptions of the analysis.
Results of Inter-rater Agreement Analysis
The present example compares the severity classifications assigned by Dermatologist 1 and Dermatologist 2 for 30 observations.
The analysis was conducted using Weighted Kappa with linear weights.
The principal findings are:
| Statistical parameter | Result |
|---|---|
| Number of observations | 30 |
| Number of observers | 2 |
| Number of categories | 4 |
| Weighted Kappa | 0.79846 |
| Standard Error | 0.07003 |
| 95% Confidence Interval | 0.66121–0.93572 |
| Weighting method | Linear |
The results demonstrate a substantial level of agreement between the two dermatologists according to the commonly used descriptive interpretation of Kappa.
The confidence interval extends from the substantial agreement range into the almost-perfect agreement range, indicating some uncertainty in the precise magnitude of agreement.
Contingency Table: Inter-rater Agreement
The contingency table presents the frequency distribution of classifications made by the two dermatologists.
Table 1. Cross-tabulation of severity classifications assigned by Dermatologist 1 and Dermatologist 2
| Dermatologist 2 | Mild | Moderate | Severe | Very Severe | Total |
|---|---|---|---|---|---|
| Mild | 5 | 1 | 0 | 0 | 6 |
| Moderate | 2 | 7 | 1 | 0 | 10 |
| Severe | 0 | 1 | 6 | 1 | 8 |
| Very Severe | 0 | 0 | 1 | 5 | 6 |
| Total | 7 | 9 | 8 | 6 | 30 |
How to Interpret the Contingency Table
The rows represent the classifications made by Dermatologist 2, whereas the columns represent the classifications made by Dermatologist 1.
The diagonal cells indicate exact agreement between the two observers.
For example:
- Five observations were classified as Mild by both dermatologists.
- Seven observations were classified as Moderate by both.
- Six observations were classified as Severe by both.
- Five observations were classified as Very Severe by both.
The total exact agreement is:
(5 + 7 + 6 + 5) / 30 × 100 = 76.67%
Therefore, both dermatologists assigned the same severity category to approximately 76.7% of observations.
The remaining observations represent disagreements of varying magnitude. Weighted Kappa incorporates the distance between these classifications rather than treating all disagreements identically.
Interpretation of Weighted Kappa Results
The estimated Weighted Kappa coefficient was 0.79846, with a standard error of 0.07003.
According to the commonly used interpretation scale, this value indicates substantial agreement between Dermatologist 1 and Dermatologist 2.
The result suggests that the consistency between the dermatologists was considerably greater than would be expected from chance agreement alone.
The 95% confidence interval ranged from 0.66121 to 0.93572. Since the interval does not include zero, it supports evidence of agreement beyond chance.
The use of linear weights is particularly relevant because the four severity classifications represent an ordered scale. A disagreement between adjacent severity categories receives a smaller penalty than a disagreement involving categories that are far apart.
Overall, the findings indicate good consistency in the severity assessment performed by the two dermatologists.
Frequency Chart Interpretation
The graphical output provides a visual representation of the distribution of severity classifications across the two observers.
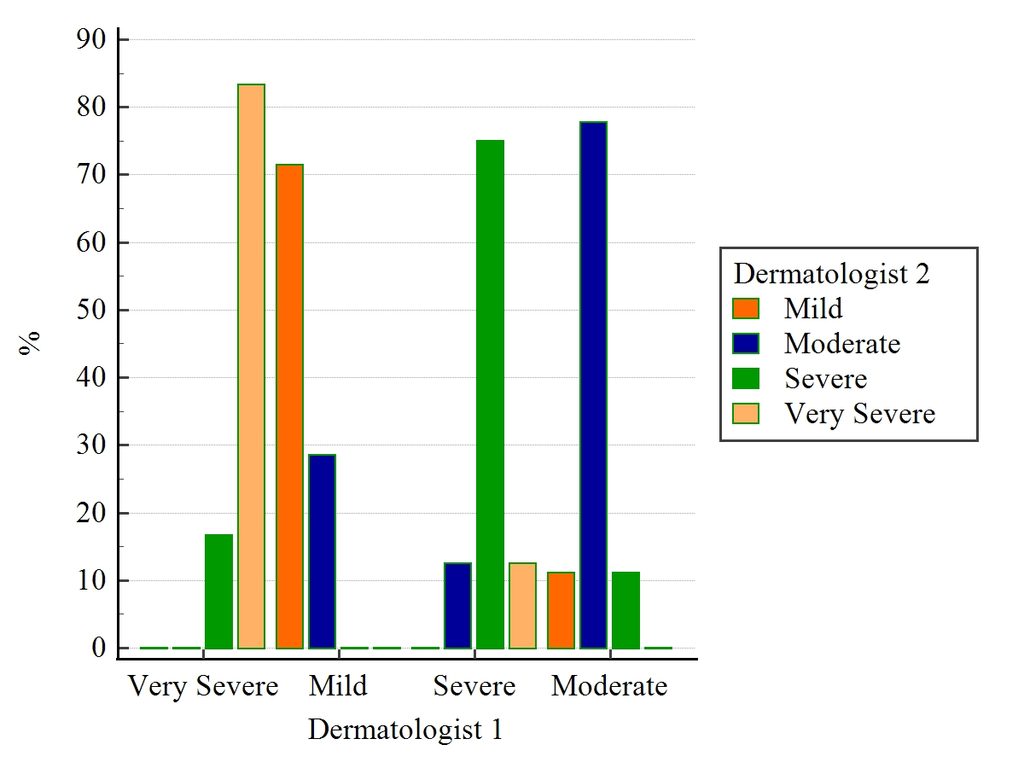
The graph contains the following elements:
- X-axis: Severity categories.
- Y-axis: Percentage (%).
- Legend: Dermatologist 2 classification categories.
- Bar colours: Different severity classifications.
The grouped bars allow the reader to compare the distribution of observer classifications across the severity categories.
The graphical representation complements the contingency table by making differences in classification frequencies easier to observe.
However, the graph should not be interpreted as a direct measure of Kappa. The Kappa coefficient is calculated from the complete paired classification data, including the agreement and disagreement pattern.
Therefore, the contingency table and weighted Kappa statistic should be used together when interpreting inter-rater agreement.
Figure 1. Frequency distribution of severity classifications between Dermatologist 1 and Dermatologist 2.
How to Present the Results in a Research Paper
Researchers can report the findings in a concise statistical format.
Publication-Ready Result Table
Table 2. Weighted Kappa analysis for inter-rater agreement between two dermatologists
| Parameter | Value |
|---|---|
| Weighted Kappa (κ) | 0.79846 |
| Standard Error | 0.07003 |
| 95% CI | 0.66121–0.93572 |
| Weighting method | Linear |
| Interpretation | Substantial agreement |
Note: Weighted Kappa was calculated using linear weights for four ordinal severity categories.
Example of Results Writing
Inter-rater agreement between Dermatologist 1 and Dermatologist 2 was evaluated using Weighted Kappa analysis with linear weights. The analysis demonstrated substantial agreement between the observers (κ = 0.79846, SE = 0.07003, 95% CI: 0.66121–0.93572). Exact agreement was observed in 76.7% of the 30 assessments. These findings indicate good consistency between the two dermatologists in classifying the severity categories.
Advantages of Weighted Kappa Analysis
Weighted Kappa offers several advantages in biomedical and scientific research.
- It measures agreement beyond chance.
- It is suitable for ordinal categorical data.
- It accounts for the magnitude of disagreement.
- It provides a standardized agreement coefficient.
- It supports reproducibility assessment.
- It can be reported with confidence intervals.
- It helps evaluate consistency between clinical observers.
Limitations of Kappa Statistics
Although Kappa is a valuable statistical method, several considerations should be noted.
Kappa values can be influenced by the prevalence of categories and the distribution of ratings between observers.
A high percentage of exact agreement does not necessarily produce an equally high Kappa coefficient.
The interpretation of Kappa also depends on the weighting method selected. Linear and quadratic weights may produce different estimates.
Additionally, Cohen’s Kappa is designed for two observers. Studies involving more than two raters may require alternative agreement statistics.
Researchers should therefore report the weighting method, confidence interval, number of observations, and category definitions alongside the Kappa coefficient.
Conclusion
Inter-rater Agreement (Kappa) is an important statistical technique for assessing the consistency of categorical assessments made by independent observers.
In this MedCalc tutorial, Weighted Kappa with linear weights was used to evaluate agreement between two dermatologists who classified 30 observations into four severity categories.
The analysis produced a Weighted Kappa coefficient of 0.79846, with a standard error of 0.07003 and a 95% confidence interval of 0.66121–0.93572.
The findings indicate substantial agreement between the two observers, with exact agreement observed in 76.7% of assessments.
The contingency table provides detailed information about matching and differing classifications, while the frequency chart offers a visual comparison of the observer distributions.
MedCalc simplifies the calculation and presentation of inter-rater agreement statistics, making it useful for students, researchers, clinicians, and biomedical scientists.