Introduction
In biomedical and clinical research, measurements are often performed by more than one observer, clinician, radiologist, laboratory technician, or instrument. Before using these measurements for research or clinical decisions, it is important to determine whether they are sufficiently reliable and reproducible.
The Intraclass Correlation Coefficient (ICC) is an important statistical method for evaluating the reliability of quantitative measurements made by two or more raters on the same subjects. It is widely used in medical, biological, radiological, and clinical research.
In this tutorial, we demonstrate ICC analysis using 20 patients measured by four radiologists. The analysis is performed in MedCalc Statistical Software, using the same raters for all subjects and absolute agreement.
What is Intraclass Correlation Coefficient?
The Intraclass Correlation Coefficient (ICC) is a measure of reliability that evaluates how consistently multiple raters or measurement methods measure the same subjects.
In simple terms, ICC answers the question:
How similar and reliable are the measurements obtained from different raters for the same subjects?
For example, suppose four radiologists independently measure the diameter of a lesion in the same 20 patients. If their measurements are very similar, the ICC will be high. If their measurements differ substantially, the ICC will be lower.
ICC is different from a simple Pearson correlation. Pearson correlation mainly evaluates the linear association between measurements, whereas ICC is designed to evaluate reliability and agreement within repeated measurements.
ICC can be used for:
- Inter-rater reliability
- Intra-rater reliability
- Test-retest reliability
- Repeated quantitative measurements
- Medical imaging measurements
- Laboratory measurements
- Anthropometric measurements
- Clinical assessment scales
- Instrument comparison
Concept of ICC
The basic concept behind ICC is the comparison of:
Variation between subjects
with
Measurement error or variation between raters
When measurements from different raters are highly reliable, subjects who have larger measurements tend to remain larger across raters, while subjects with smaller measurements remain smaller.
Conceptually:
High ICC → small measurement error relative to differences between subjects
Low ICC → greater measurement variability relative to differences between subjects
ICC values are commonly interpreted between 0 and 1, although some ICC formulations can produce negative values under certain circumstances. Values closer to 1 indicate stronger reliability.
Biomedical Example Dataset
For this MedCalc tutorial, an educationally generated radiology dataset is used.
Example
20 patients × 4 radiologists
Each radiologist independently measured the same lesion using ultrasound.
| Patient ID | Radiologist 1 (mm) | Radiologist 2 (mm) | Radiologist 3 (mm) | Radiologist 4 (mm) |
|---|---|---|---|---|
| 1 | 42 | 49 | 37 | 46 |
| 2 | 42 | 52 | 52 | 46 |
| 3 | 59 | 52 | 57 | 54 |
| 4 | 54 | 68 | 58 | 66 |
| 5 | 73 | 65 | 69 | 63 |
| 6 | 67 | 78 | 68 | 79 |
| 7 | 83 | 76 | 70 | 80 |
| 8 | 77 | 89 | 82 | 75 |
| 9 | 90 | 81 | 88 | 84 |
| 10 | 86 | 98 | 83 | 94 |
| 11 | 99 | 91 | 94 | 87 |
| 12 | 92 | 102 | 103 | 96 |
| 13 | 105 | 97 | 97 | 107 |
| 14 | 98 | 109 | 110 | 102 |
| 15 | 112 | 106 | 115 | 108 |
| 16 | 107 | 119 | 109 | 121 |
| 17 | 122 | 112 | 118 | 114 |
| 18 | 117 | 129 | 118 | 127 |
| 19 | 132 | 124 | 119 | 130 |
| 20 | 127 | 136 | 122 | 133 |
Important: This is an educationally generated dataset and does not represent real patient measurements.
📥 Download the ICC Biomedical Practice Dataset (Excel)
How to Perform ICC Analysis in MedCalc
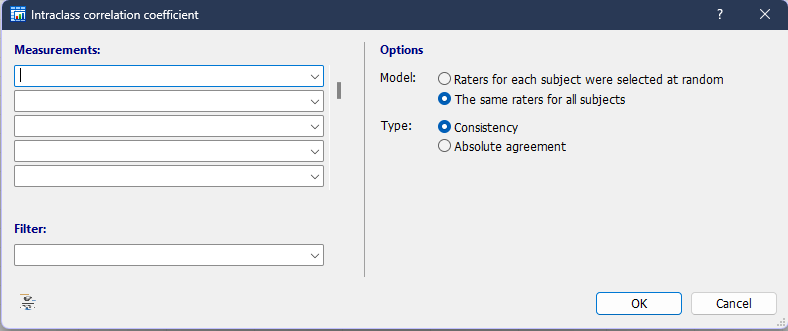
Open MedCalc and navigate to the Intraclass correlation coefficient procedure.
The dialog contains:
- Measurements
- Filter
- Model
- Type
The official MedCalc documentation identifies the same four components for the ICC procedure.
1. Measurements
The Measurements section is where you select the variables representing the different raters.
For our example:
| MedCalc Measurement | Variable |
|---|---|
| Measurement 1 | Radiologist 1 |
| Measurement 2 | Radiologist 2 |
| Measurement 3 | Radiologist 3 |
| Measurement 4 | Radiologist 4 |
Patient ID should not be entered as a measurement variable.
The MedCalc output confirms that the four selected variables were Radiologist 1, Radiologist 2, Radiologist 3 and Radiologist 4.
2. Filter
The Filter option allows you to restrict the analysis to a particular subgroup.
For example, a dataset might contain:
- Male and female patients
- Different age groups
- Different disease categories
- Different treatment groups
- Different hospitals
If you want to analyze all subjects, leave the filter empty or select None.
For our example:
Filter = None
Therefore, all 20 patients are included.
3. Model
MedCalc provides two model choices.
Raters for each subject were selected at random
This option is appropriate when different subjects are evaluated by different randomly selected raters.
For example:
| Patient | Raters |
|---|---|
| Patient 1 | A, B, D |
| Patient 2 | B, C, E |
| Patient 3 | A, C, D |
The same raters are not necessarily used for every subject.
MedCalc indicates that this model is used when the raters are selected randomly for each subject.
The same raters for all subjects
This is the option used for our dataset.
All 20 patients are measured by the same four radiologists.
Therefore:
Model = The same raters for all subjects
MedCalc reports this as a two-way model in the output.
4. Type
MedCalc provides two choices when the same raters are used:
Consistency
Consistency evaluates whether the raters maintain the same relative pattern among subjects.
Systematic differences between raters are considered less important for this definition.
Absolute Agreement
Absolute agreement evaluates whether raters provide similar actual numerical measurements.
Systematic differences between raters are therefore relevant.
MedCalc’s documentation specifically distinguishes consistency from absolute agreement based on whether systematic differences between raters are considered important.
Setting used in this example
For the radiologist lesion measurements:
Type = Absolute agreement
The actual MedCalc result confirms Absolute agreement.
This is useful when measurements from different radiologists need to be interpreted as interchangeable numerical measurements.
MedCalc Result
The MedCalc analysis produced the following results:
| Parameter | Result |
|---|---|
| Number of subjects | 20 |
| Number of raters | 4 |
| Model | Same raters for all subjects |
| Model type | Two-way |
| Type | Absolute agreement |
| Single-measures ICC | 0.9571 |
| 95% CI | 0.9182–0.9807 |
| Average-measures ICC | 0.9889 |
| 95% CI | 0.9782–0.9951 |
These values are taken directly from the supplied MedCalc result file.
Interpretation of the ICC Result
Single-measures ICC = 0.9571
The single-measures ICC represents the reliability of a measurement obtained from one typical rater.
The result is:
ICC = 0.9571
The 95% confidence interval is:
0.9182 to 0.9807
This indicates a high level of reliability for a single radiologist’s measurement in this educational dataset.
Using commonly cited guideline ranges, ICC values above 0.90 are described as excellent reliability. These cutoffs are guidelines rather than universal clinical rules, and ICC interpretation should consider study design and population characteristics.
Importantly, the entire 95% confidence interval is above 0.90, from 0.9182 to 0.9807.
verage-measures ICC = 0.9889
The average-measures ICC evaluates the reliability when the measurements from the four raters are averaged.
The result is:
ICC = 0.9889
95% CI:
0.9782 to 0.9951
This is higher than the single-measures ICC.
That difference is expected because averaging measurements from several raters can reduce the contribution of random measurement error. MedCalc specifically reports single-measures and average-measures ICC separately.
The result therefore indicates very high reliability for the average of the four radiologists’ measurements in this dataset.
Result Table Explanation
The result table can be presented in an article as follows:
Table 1. Intraclass correlation coefficient for ultrasound lesion measurements by four radiologists
| ICC Measure | ICC | 95% Confidence Interval | Interpretation |
|---|---|---|---|
| Single measures | 0.9571 | 0.9182–0.9807 | Excellent reliability* |
| Average measures | 0.9889 | 0.9782–0.9951 | Excellent reliability* |
*Based on commonly used guideline ranges; interpretation should also consider the study population, measurement purpose, and confidence interval.
The MedCalc output defines the first value as the reliability of single ratings and the second as the reliability of averages of k ratings.
Plot Interpretation
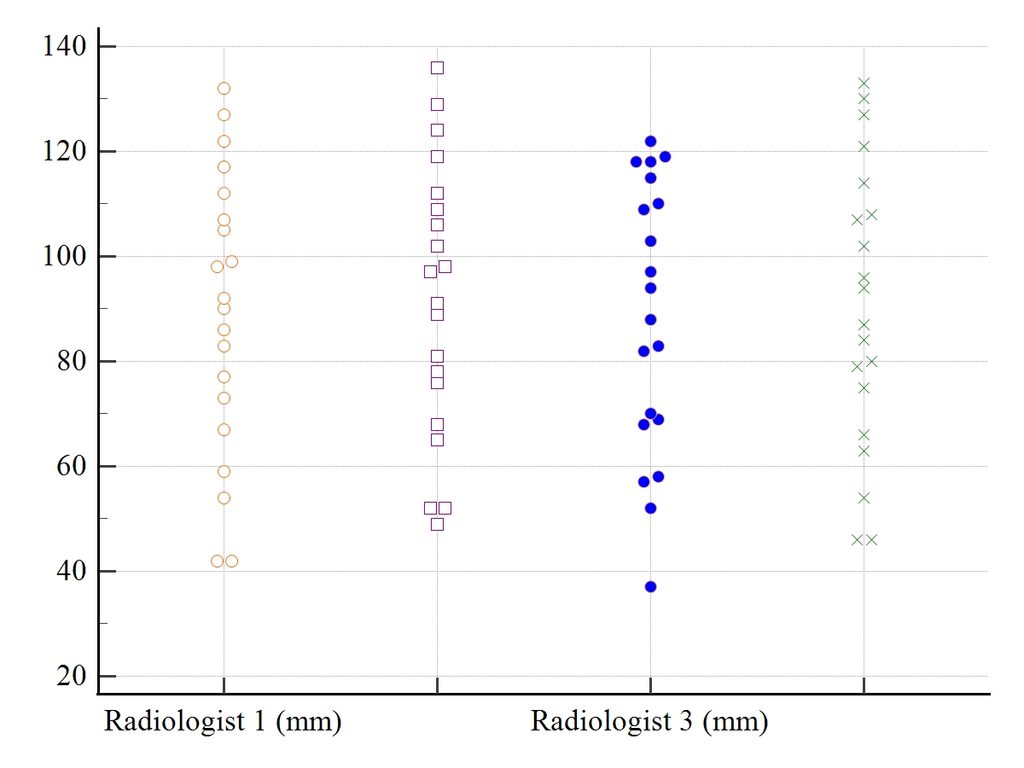
The supplied plot displays the measurements from the four radiologists as separate vertical groups.
Each individual point represents a patient’s measurement by a particular radiologist.
The graph allows us to visually examine:
- The range of measurements for each radiologist
- The distribution of measurements
- Similarity in the overall pattern across raters
- Possible unusually high or low observations
- Whether the four groups broadly follow a similar measurement pattern
The four groups show measurements covering a similar overall range, with the points distributed across approximately 40–140 mm. The general pattern is comparable across the radiologists, although individual measurements are not identical.
This visual pattern is compatible with the high ICC obtained from the formal reliability analysis.
Important point
The graph itself does not calculate ICC.
It is a descriptive visualization of the measurements. The ICC result provides the formal quantitative assessment of reliability.
Therefore, the plot and ICC result should be interpreted together rather than treating the graph as a substitute for ICC.
Why Absolute Agreement Is Important
Suppose two radiologists measure the same patients, but one radiologist consistently records values several millimeters higher.
The patients may still have the same ranking from smallest to largest lesion.
A consistency ICC could remain high because the relative ordering is preserved.
However, if the actual numerical measurements need to be interchangeable, the systematic difference matters.
This is why absolute agreement is appropriate when the actual measured values are important.
MedCalc gives the same conceptual distinction between consistency and absolute agreement.
ICC vs Pearson Correlation
A common mistake is to assume that a high Pearson correlation automatically demonstrates good measurement reliability.
It does not.
Correlation evaluates association, whereas ICC is designed for reliability assessment involving repeated measurements or ratings of the same subjects.
For example, two radiologists could produce highly correlated results while one consistently measures slightly higher than the other.
Therefore, in reliability studies, the ICC model, type, and intended interpretation should be clearly reported. Koo and Li emphasize that different ICC forms have different assumptions and interpretations, so researchers should explicitly report the ICC form used.
How to Report This Result in a Research Paper
A suitable reporting statement for this educational example would be:
“Inter-rater reliability of lesion diameter measurements obtained by four radiologists was assessed using a two-way ICC with absolute agreement. The single-measures ICC was 0.9571 (95% CI: 0.9182–0.9807), while the average-measures ICC was 0.9889 (95% CI: 0.9782–0.9951), indicating high reliability.”
When reporting an ICC in a scientific paper, it is important to specify the model, type/definition, whether single or average measures were used, and the confidence interval.
Conclusion
The Intraclass Correlation Coefficient (ICC) is an important method for assessing the reliability of quantitative measurements in biomedical research.
In this MedCalc example, 20 patients were measured by four radiologists. Because the same four radiologists measured every patient, the appropriate MedCalc model was “The same raters for all subjects.” The analysis used absolute agreement because the actual numerical measurements were important.
The resulting single-measures ICC was 0.9571 (95% CI: 0.9182–0.9807), while the average-measures ICC was 0.9889 (95% CI: 0.9782–0.9951).
These results indicate high reliability for the measurements in this educational dataset. However, ICC should always be selected and interpreted according to the study design, rater structure, measurement purpose, and intended use of the results.
The combination of a clear measurement design, appropriate ICC model, confidence interval, and graphical examination provides a stronger framework for evaluating reliability in biomedical research.