Introduction
Regression analysis is one of the most important statistical techniques used in biostatistics. Researchers, healthcare professionals, epidemiologists, and scientists use regression models to understand relationships between variables and predict outcomes. A key component of any regression model is the regression coefficient, which quantifies the relationship between an independent variable and a dependent variable.
For example, researchers may want to investigate how age, body mass index (BMI), and blood pressure influence the risk of cardiovascular disease. Regression coefficients help determine the magnitude and direction of these effects.
Understanding regression coefficients is essential for interpreting statistical results accurately and making evidence-based decisions in biological and medical research. This article explains regression coefficients in biostatistics, their significance, interpretation, calculation, and practical applications with examples.
What are Regression Coefficients?
A regression coefficient is a numerical value that represents the relationship between a predictor variable (independent variable) and an outcome variable (dependent variable) in a regression model.
It indicates:
- The direction of the relationship
- The strength of the relationship
- The expected change in the outcome variable for a one-unit change in the predictor variable
The general equation for simple linear regression is:
Where:
| Symbol | Meaning |
|---|---|
| Y | Dependent variable |
| X | Independent variable |
| β₀ | Intercept |
| β₁ | Regression coefficient |
| ε | Error term |
The coefficient β₁ measures how much Y changes when X increases by one unit.
Importance of Regression Coefficients in Biostatistics
Regression coefficients provide valuable insights in biomedical and healthcare research.
They help researchers:
- Identify risk factors for diseases
- Measure treatment effects
- Predict clinical outcomes
- Evaluate public health interventions
- Understand biological relationships
For instance, a positive coefficient between smoking and lung cancer risk suggests that increased smoking is associated with increased disease risk.
Understanding the Components of a Regression Model
1. Intercept (β₀)
The intercept is the expected value of the dependent variable when all predictor variables equal zero.
Example:
Here:
- Intercept = 40
- Predicted weight is 40 kg when height is zero
Although biologically unrealistic, the intercept serves as the baseline value.
2. Regression Coefficient (β₁)
The coefficient shows how much the outcome variable changes for a one-unit increase in the predictor variable.
Example:
Interpretation:
- Every additional year of age increases blood pressure by 1.5 units on average.
Types of Regression Coefficients
1. Unstandardized Coefficient
The coefficient is expressed in the original measurement units.
Example:
- Age coefficient = 2.3
Interpretation:
- Every one-year increase in age increases systolic blood pressure by 2.3 mmHg.
2. Standardized Coefficient
Variables are standardized before analysis.
Advantages:
- Allows comparison among predictors
- Removes unit differences
- Helps identify the strongest predictor
Example:
| Variable | Standardized Coefficient |
|---|---|
| Age | 0.35 |
| BMI | 0.60 |
| Exercise | -0.25 |
BMI has the strongest effect because it has the largest absolute coefficient.
Interpretation of Regression Coefficients
Positive Coefficient
A positive coefficient indicates a direct relationship.
Example:
Interpretation:
- As height increases, weight increases.
Negative Coefficient
A negative coefficient indicates an inverse relationship.
Example:
Interpretation:
- Each additional hour of exercise decreases blood sugar by 5 units.
Zero Coefficient
A coefficient close to zero indicates little or no relationship.
Example:
Hair length has minimal influence on disease risk.
Step-by-Step Example of Regression Coefficients
Suppose a researcher studies the effect of age on systolic blood pressure.
Sample Data
| Participant | Age (Years) | Blood Pressure (mmHg) |
|---|---|---|
| 1 | 25 | 110 |
| 2 | 30 | 115 |
| 3 | 35 | 122 |
| 4 | 40 | 128 |
| 5 | 45 | 135 |
Regression analysis produces:
Interpretation
Intercept = 85
- Predicted blood pressure at age 0 is 85 mmHg.
Coefficient = 1.1
- For every one-year increase in age, blood pressure increases by approximately 1.1 mmHg.
For a person aged 50:
Predicted blood pressure = 140 mmHg.
Multiple Regression Coefficients
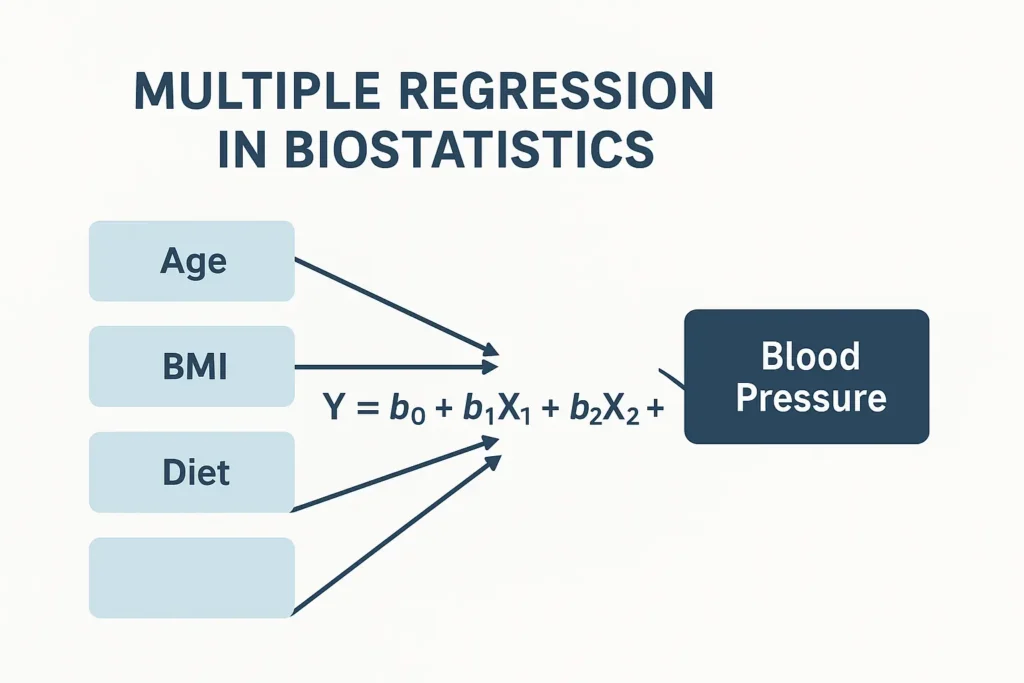
In biostatistics, researchers often study several variables simultaneously.
The model becomes:
Example:
Where:
- BP = Blood Pressure
- Age = Years
- BMI = Body Mass Index
- Exercise = Weekly exercise hours
Interpretation
Age Coefficient (0.8)
Holding BMI and exercise constant:
- One-year increase in age increases BP by 0.8 mmHg.
BMI Coefficient (1.5)
Holding other variables constant:
- One-unit increase in BMI increases BP by 1.5 mmHg.
Exercise Coefficient (-2.2)
Holding other variables constant:
- One additional hour of exercise reduces BP by 2.2 mmHg.
Table: Interpretation of Regression Coefficients
| Coefficient Value | Interpretation |
|---|---|
| Positive | Direct relationship |
| Negative | Inverse relationship |
| Zero | No relationship |
| Large Positive | Strong positive effect |
| Large Negative | Strong negative effect |
| Small Value | Weak effect |
Conceptual Representation of Regression Coefficients
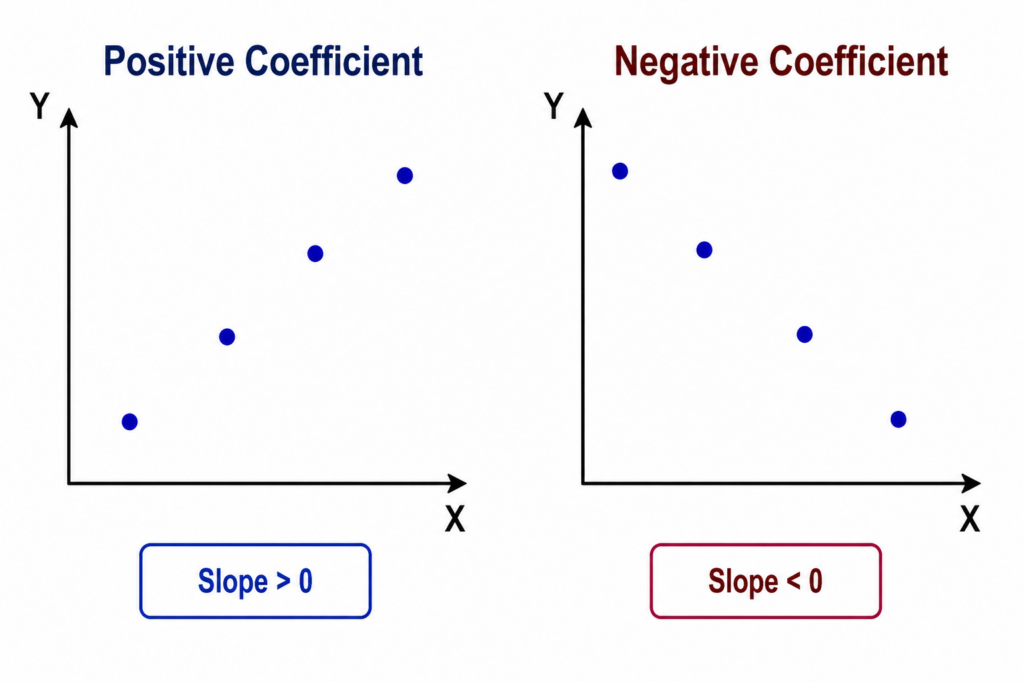
In the positive coefficient graph, Y increases as X increases.
In the negative coefficient graph, Y decreases as X increases.
Statistical Significance of Regression Coefficients
A coefficient may exist, but researchers must determine whether it is statistically significant.
Common measures include:
P-value
- p < 0.05 → Significant relationship
- p ≥ 0.05 → Not statistically significant
Example:
| Variable | Coefficient | P-value |
|---|---|---|
| Age | 1.2 | 0.001 |
| BMI | 2.1 | 0.002 |
| Exercise | -0.8 | 0.120 |
Interpretation:
- Age and BMI significantly affect blood pressure.
- Exercise does not significantly affect blood pressure in this dataset.
Confidence Intervals for Regression Coefficients
Confidence intervals indicate the range within which the true coefficient likely falls.
Example:
| Variable | Coefficient | 95% CI |
|---|---|---|
| Age | 1.2 | 0.8 – 1.6 |
| BMI | 2.0 | 1.3 – 2.7 |
If the confidence interval does not contain zero, the coefficient is generally considered statistically significant.
Applications of Regression Coefficients in Biostatistics
Clinical Research
- Evaluating treatment effectiveness
- Drug response analysis
Epidemiology
- Identifying disease risk factors
- Studying exposure-outcome relationships
Public Health
- Assessing intervention effectiveness
- Predicting disease prevalence
Genetics
- Investigating gene-expression relationships
Healthcare Management
- Predicting hospital outcomes
- Resource allocation planning
Advantages of Regression Coefficients
- Easy interpretation
- Quantifies relationships
- Supports prediction models
- Useful in medical decision-making
- Applicable to various study designs
Limitations of Regression Coefficients
- Sensitive to outliers
- Influenced by multicollinearity
- Assumes model assumptions are satisfied
- Correlation does not imply causation
- Results depend on data quality
Best Practices for Interpreting Regression Coefficients
- Examine coefficient sign and magnitude.
- Check statistical significance.
- Review confidence intervals.
- Assess model assumptions.
- Consider clinical relevance.
- Interpret coefficients within the study context.
- Avoid causal conclusions without proper study design.
Conclusion
Regression coefficients are fundamental components of regression analysis in biostatistics. They quantify the relationship between predictor variables and outcomes, helping researchers understand, predict, and explain biological and medical phenomena. Whether used in simple linear regression or complex multivariable models, regression coefficients provide valuable insights into disease risk factors, treatment effects, and healthcare outcomes. Proper interpretation requires consideration of coefficient magnitude, direction, statistical significance, and confidence intervals. By mastering regression coefficients, researchers can make more informed decisions and draw meaningful conclusions from biomedical data.