
Introduction
Survival analysis is a crucial statistical method in biomedical research used to analyze time-to-event data such as patient survival time, disease recurrence, or treatment outcomes. One of the most powerful models in survival analysis is the Cox Proportional Hazards Regression.
In this tutorial, we explain how to perform Cox regression using MedCalc software, interpret results, and understand survival curves using real biomedical data.
What is Cox Proportional Hazards Regression?
Cox regression is a semi-parametric model used to evaluate the effect of multiple variables on survival time. It estimates the hazard ratio (HR), which indicates how a predictor variable affects the risk of an event occurring.
Key Concept
- Hazard = Risk of event at a given time
- Hazard Ratio (HR):
- HR > 1 → Increased risk
- HR < 1 → Decreased risk
- HR = 1 → No effect
Example Dataset (Biomedical)
| Time (months) | Status | Treatment | Age | Gender |
|---|---|---|---|---|
| 5 | 1 | 1 | 60 | 1 |
| 8 | 0 | 1 | 55 | 2 |
| 6 | 1 | 2 | 70 | 1 |
👉 Coding:
- Status → 1 = Event, 0 = Censored
- Treatment → 1 = Drug A, 2 = Drug B
- Gender → 1 = Male, 2 = Female
👉 Download Dataset
Step-by-Step Cox Regression in MedCalc
Step 1: Open Analysis
Go to:
👉 Statistics → Survival Analysis → Cox regression
Step 2: Select Variables
- Survival time → Time_months_
- Endpoint → Status
- Define: 1 = Event, 0 = Censored
- Predictor variables →
- Treatment
- Age
- Gender
Step 3: Choose Method
Enter (Used in your analysis)
- Includes all variables simultaneously
- Best for beginners
Step 4: Categorical Variables
👉 Click Categorical…
Select:
- Treatment
- Gender
Step 5: Graph Options
- ✔ Survival probability (%)
- ✔ Graph subgroups (optional)
Step 6: Run Analysis
Click OK
Options Explanation
Method Options
| Method | Explanation |
|---|---|
| Enter | Includes all predictors |
| Forward | Adds variables stepwise |
| Backward | Removes variables |
| Stepwise | Combination |
👉 Your analysis used Enter method ✅
P-value Settings
- Enter variable if P < 0.05
- Remove if P > 0.1
👉 Used only in stepwise methods
Graph Options
- Survival probability (%) → Standard curve
- 100 – survival → Failure probability
Results Interpretation
Case Summary
- Total cases = 30
- Events = 18 (60%)
- Censored = 12 (40%)
👉 Dataset is sufficient for Cox regression
Model Fit
- Chi-square = 2.090
- P-value = 0.554
👉 ❗ Model is not statistically significant
Hazard Ratios (Important)
Treatment
- HR = 2.57
👉 Patients in Drug B group may have higher risk
👉 But P = 0.282 → Not significant
Age
- HR ≈ 1
👉 No effect on survival
Gender
- HR = 3.64
👉 Higher risk in one gender
👉 But not significant
Survival Curve Interpretation
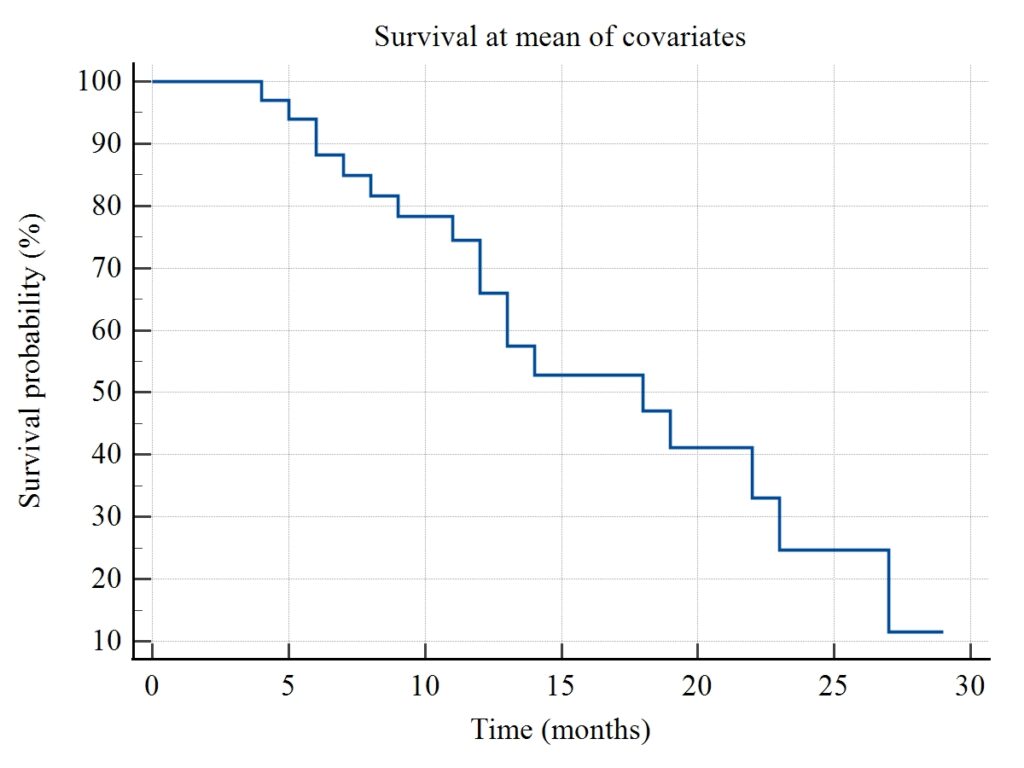
Based on your graph:
- Survival starts at 100%
- Gradually decreases over time
- Step-like pattern shows event occurrence
Key Observations
✔ Sharp drops = events
✔ Flat line = no events
✔ End survival ≈ 10–15%
👉 Indicates decreasing survival probability over time
Baseline Hazard Interpretation
- Survival reduces from 97% → 11%
- Shows increasing cumulative hazard
Model Accuracy
- Harrell’s C-index = 0.590
👉 Interpretation:
- Model has moderate predictive ability
Important Note
Even though hazard ratios are high:
👉 P-values are not significant
👉 This means:
- No strong statistical evidence
- Larger sample size needed
Conclusion
Cox Proportional Hazards Regression is a powerful tool for analyzing survival data and identifying risk factors in biomedical studies. In this MedCalc tutorial:
✔ We learned how to prepare numeric data
✔ Performed Cox regression step-by-step
✔ Explained options and methods
✔ Interpreted hazard ratios and survival curve
Although the model was not statistically significant, the analysis demonstrates how Cox regression helps evaluate survival risk.


