
Introduction
Kaplan–Meier Survival Analysis is one of the most widely used statistical methods in biomedical research to estimate the survival probability of subjects over time. It is particularly useful when dealing with censored data, which commonly occurs in clinical trials where not all subjects experience the event of interest during the study period.
Definition
Kaplan–Meier Survival Analysis is a non-parametric statistical method used to estimate the survival function from time-to-event data.
👉 It calculates the probability that a subject survives beyond a certain time.
Concept Explanation
🔹 Key Concepts:
- Survival Time: Time until the event occurs (e.g., death, relapse)
- Event (Status = 1): Occurrence of outcome
- Censored Data (Status = 0): Subject did not experience event during study
- Survival Function (S(t)): Probability of surviving past time t
- Hazard: Risk of event at a specific time
🔹 Kaplan–Meier Formula:
Where:
- = number of events at time i
- = number at risk at time i
Data Format
Your dataset in MedCalc includes:
| Variable | Description |
|---|---|
| Time_months | Survival time |
| Status | Event indicator (1 = event, 0 = censored) |
| Treatment | Group (Drug A / Drug B) |
📥 Download Dataset:
Step-by-Step Procedure in MedCalc
Step 1: Open MedCalc
- Launch MedCalc software
Step 2: Enter Data
- Input three columns:
- Time (months)
- Status (0/1)
- Treatment group
Step 3: Select Analysis
- Go to:
Statistics → Survival Analysis → Kaplan-Meier
Step 4: Assign Variables
- Survival time → Time_months
- Event indicator → Status
- Factor → Treatment
Step 5: Choose Options
- Confidence Interval (95%)
- Display survival table
- Compare groups (Log-rank test)
Step 6: Generate Output
- Click OK
- MedCalc produces:
- Survival curves
- Summary tables
- Statistical tests
Step-by-Step Result Explanation
Cases Summary
From your output :
| Group | Events | Censored | Total |
|---|---|---|---|
| Drug A | 5 (62.5%) | 3 | 8 |
| Drug B | 4 (57.14%) | 3 | 7 |
👉 Interpretation:
- Both groups have similar event proportions
- Slightly higher events in Drug A
Mean and Median Survival
| Group | Mean Survival | Median Survival |
|---|---|---|
| Drug A | 15.5 months | 18 months |
| Drug B | 13.4 months | 14 months |
👉 Interpretation:
- Drug A shows higher survival time
- Median survival is notably better in Drug A
Survival Table
The survival table shows survival probabilities at different times.
Example:
- At time 5 → Survival ≈ 87.5% (Drug A)
- At time 14 → Survival drops significantly
👉 Interpretation:
- Survival decreases stepwise over time
- Each drop represents an event
Kaplan–Meier Plot Interpretation
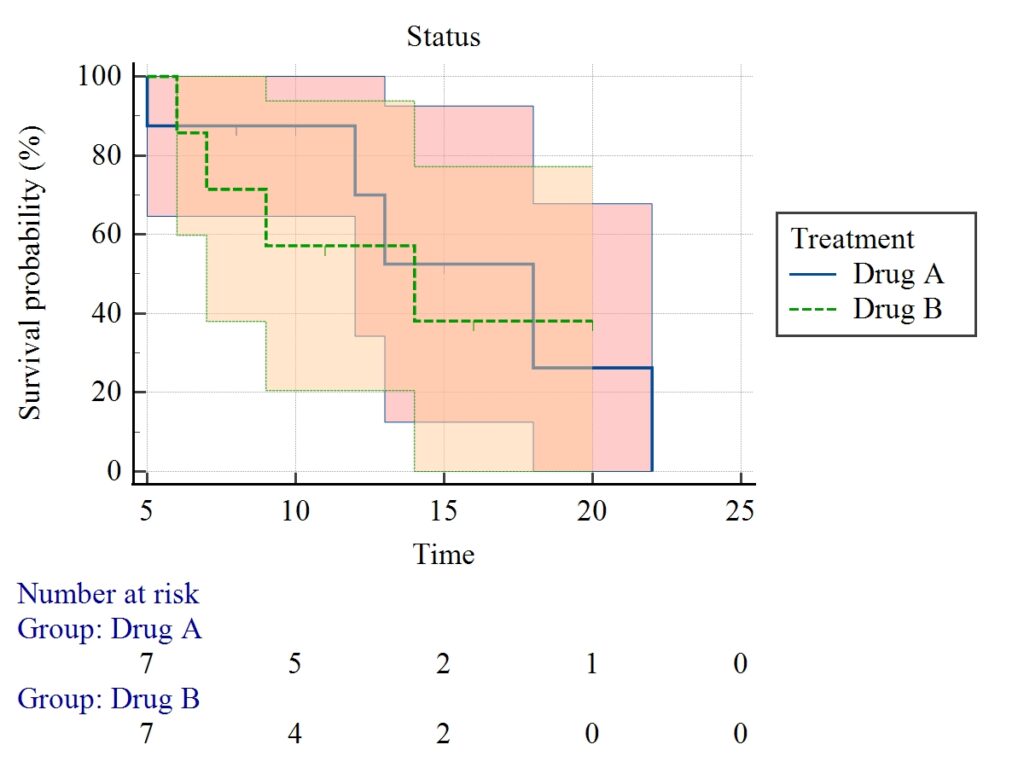
Key Features of Your Graph:
- Step-down curves: Each drop = event occurrence
- Two groups:
- Blue line → Drug A
- Green dashed → Drug B
- Shaded area: Confidence intervals
- Number at risk table: Shows subjects remaining over time
Interpretation:
- Drug A curve stays slightly above Drug B
- Indicates better survival probability
- However, curves are close → difference is small
Log-Rank Test (Group Comparison)
From your file:
- Chi-square = 0.1185
- p-value = 0.7306
👉 Interpretation:
- p > 0.05 → Not statistically significant
- No strong evidence that Drug A is better than Drug B
Hazard Ratio
| Comparison | Hazard Ratio |
|---|---|
| Drug A vs Drug B | 1.2798 |
👉 Interpretation:
- HR > 1 suggests slightly higher risk in Drug B
- But confidence interval is wide → not significant
Conclusion
Kaplan–Meier Survival Analysis is a powerful and essential tool in biostatistics for analyzing time-to-event data. Using MedCalc, researchers can easily generate survival curves, compare treatment groups, and interpret clinical outcomes.
In your analysis:
- Drug A shows slightly better survival
- However, statistical tests confirm no significant difference between treatments
Thus, Kaplan–Meier analysis not only provides visual insights but also supports evidence-based conclusions in biomedical research.


