
Introduction
A continuous measure meta-analysis is used when research studies report outcomes in the form of numerical values with means and standard deviations. Researchers commonly compare:
- Treatment group mean
- Control group mean
- Standard deviation
- Number of participants
The software then calculates an overall pooled effect size to determine whether the intervention is statistically significant across all included studies.
MedCalc provides an easy graphical interface for conducting continuous outcome meta-analysis using:
- Fixed effects model
- Random effects model
- Forest plot
- Funnel plot
- Publication bias tests
The uploaded MedCalc report contains data from 8 studies comparing intervention and control groups using the Standardized Mean Difference (SMD) method.
Definition of Continuous Measure Meta-Analysis
Continuous measure meta-analysis is a statistical procedure used to combine mean differences from multiple studies where outcomes are measured numerically.
The most common effect measures include:
- Mean Difference (MD)
- Standardized Mean Difference (SMD)
In this analysis, the Standardized Mean Difference (SMD) is used because studies may use different scales or measurement methods.
The SMD formula is:
Where:
- = Mean of intervention group
- = Mean of control group
- = Combined standard deviation
Concept of Continuous Measure Meta-Analysis
The main objective of continuous meta-analysis is to estimate the overall treatment effect from several studies.
Key Concepts
1. Effect Size
Effect size measures the magnitude of treatment difference between intervention and control groups.
2. Standardized Mean Difference (SMD)
SMD standardizes results so studies using different measurement scales can be compared.
3. Fixed Effects Model
Assumes all studies estimate the same true effect.
4. Random Effects Model
Assumes study effects vary because of differences in populations, settings, or methodologies.
5. Heterogeneity
Measures variation among included studies.
6. Publication Bias
Occurs when studies with significant findings are more likely to be published.
Data Used in This Analysis
The uploaded MedCalc report includes 8 studies with the following variables:
| Variable | Description |
|---|---|
| Study | Study name |
| Int_N | Number of cases in intervention group |
| Int_Mean | Mean value in intervention group |
| Int_SD | Standard deviation in intervention group |
| Ctrl_N | Number of cases in control group |
| Ctrl_Mean | Mean value in control group |
| Ctrl_SD | Standard deviation in control group |
The total sample size used in this meta-analysis is:
| Group | Sample Size |
|---|---|
| Intervention | 285 |
| Control | 285 |
| Total | 570 |
Step-by-Step Procedure in MedCalc
Step 1: Prepare Dataset
Create a dataset containing:
- Study names
- Intervention sample size
- Intervention mean
- Intervention SD
- Control sample size
- Control mean
- Control SD
Step 2: Open MedCalc
Launch MedCalc Statistical Software.
Step 3: Select Meta-Analysis
Go to:
Statistics → Meta-analysis → Continuous measure
Step 4: Assign Variables
In the dialog box:
Studies
Select the study name column.
Intervention Groups
Select:
- Number of cases
- Mean
- Standard deviation
Control Groups
Select:
- Number of cases
- Mean
- Standard deviation
MedCalc Options Explanation
The uploaded options window contains several important settings.
Forest Plot
Displays individual study effects and pooled effect size graphically.
Marker Size Relative to Study Weight
Larger squares indicate studies with higher statistical weight.
Fixed Effect Model Weights
Weights studies assuming a common true effect.
Random Effect Model Weights
Weights studies while accounting for heterogeneity.
Plot Pooled Effect – Fixed Effects Model
Displays pooled estimate using fixed effects.
Plot Pooled Effect – Random Effects Model
Displays pooled estimate using random effects.
Diamonds for Pooled Effects
Diamond shapes represent overall pooled estimates.
Funnel Plot
Used to assess publication bias.
A symmetrical funnel indicates low publication bias, while asymmetry may indicate publication bias.
Example Dataset Explanation
The MedCalc output includes 8 studies.
Example: Study 1
| Parameter | Value |
|---|---|
| N1 | 30 |
| N2 | 30 |
| SMD | -1.340 |
| SE | 0.283 |
| 95% CI | -1.906 to -0.775 |
Interpretation:
- The intervention group showed significantly lower values compared with the control group.
- The confidence interval does not cross zero, indicating statistical significance.
Overall Meta-Analysis Results
Fixed Effects Model
| Parameter | Value |
|---|---|
| Total Sample Size | 570 |
| SMD | -1.390 |
| Standard Error | 0.0926 |
| 95% CI | -1.572 to -1.208 |
| t-value | -15.005 |
| P-value | <0.001 |
Interpretation
The pooled standardized mean difference is:
This indicates:
- A strong treatment effect
- The intervention significantly reduced the measured outcome compared to control
- The result is highly statistically significant because:
P<0.001
The confidence interval does not cross zero, confirming significance.
Heterogeneity Analysis
Heterogeneity Results
| Parameter | Value |
|---|---|
| Q | 2.6670 |
| DF | 7 |
| P-value | 0.9140 |
| I² | 0.00% |
Interpretation
The heterogeneity is extremely low.
I2=0%
This means:
- The included studies are highly consistent
- Study results are similar across all studies
- Fixed and random effects models produce identical results
Because heterogeneity is absent, the fixed effects model is appropriate.
Forest Plot Interpretation
Components of Forest Plot
Squares
Represent individual study effect sizes.
Horizontal Lines
Represent 95% confidence intervals.
Diamond Shape
Represents pooled effect size.
Vertical Line
Represents no-effect line.
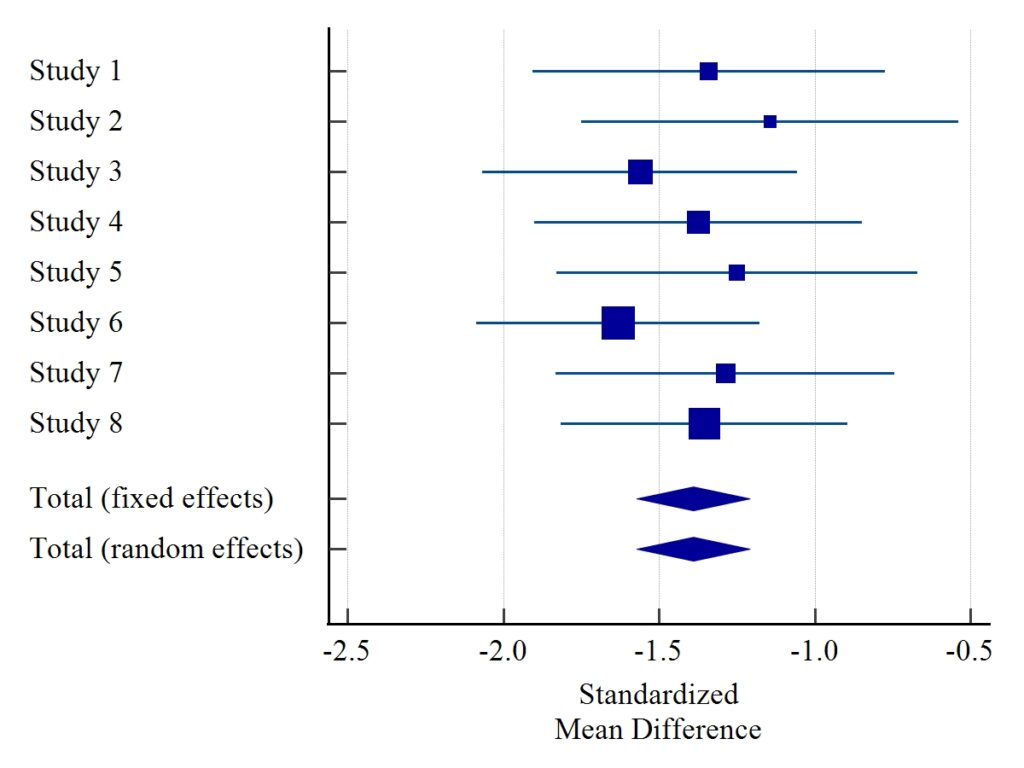
Interpretation of Forest Plot
The forest plot shows:
- All studies favor the intervention
- Most confidence intervals are narrow
- The pooled diamond lies entirely on the negative side
- No study crosses the null line
This confirms:
- Strong overall intervention effectiveness
- High consistency among studies
- Significant pooled effect
The larger squares represent studies with higher weights, such as Study 6 and Study 8.
Funnel Plot Interpretation
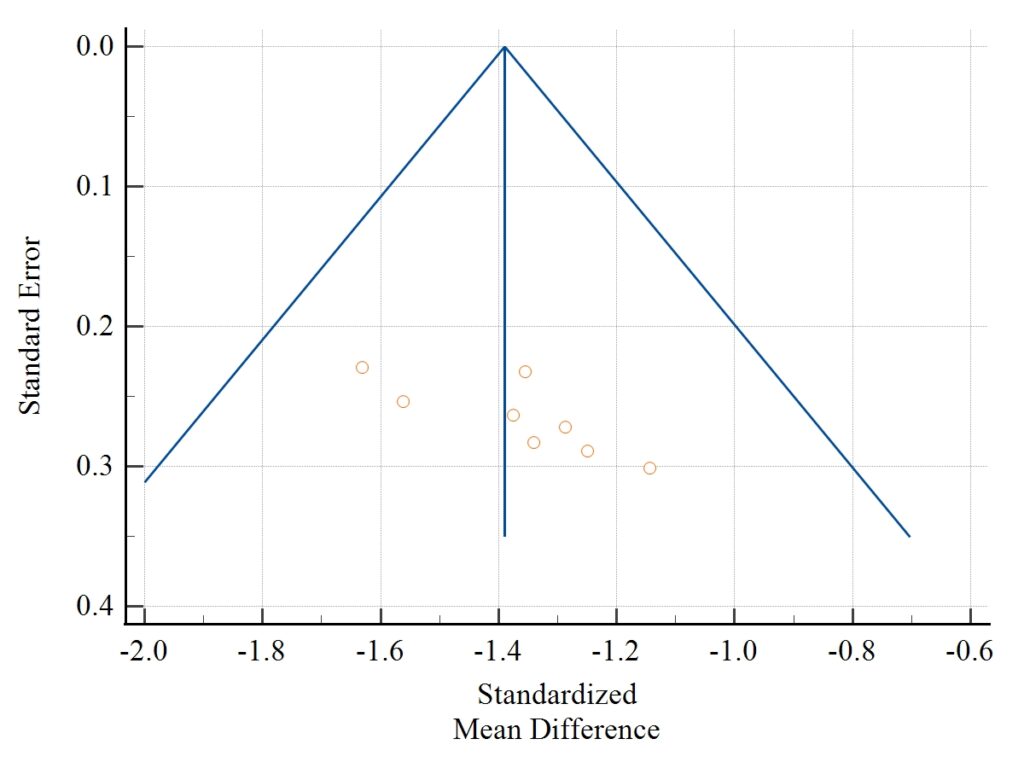
Interpretation
The funnel plot appears slightly asymmetrical.
This observation is supported by:
| Test | P-value |
|---|---|
| Egger’s Test | 0.0270 |
| Begg’s Test | 0.0065 |
Since both p-values are statistically significant, publication bias may exist.
Publication Bias Analysis
Egger’s Test
| Parameter | Value |
|---|---|
| Intercept | 4.7360 |
| 95% CI | 0.7528 to 8.7193 |
| P-value | 0.0270 |
Interpretation:
- Significant asymmetry detected
- Possible publication bias present
Begg’s Test
| Parameter | Value |
|---|---|
| Kendall’s Tau | 0.7857 |
| P-value | 0.0065 |
Interpretation:
- Significant publication bias indication
- Smaller studies may disproportionately affect results
Advantages of MedCalc Continuous Meta-Analysis
User-Friendly Interface
Easy variable selection and visualization.
Automatic Calculations
MedCalc automatically computes:
- SMD
- Confidence intervals
- Heterogeneity statistics
- Publication bias tests
High-Quality Graphs
Produces publication-ready:
- Forest plots
- Funnel plots
Supports Multiple Models
Includes both fixed and random effects models.
Limitations
- Publication bias can affect validity
- Small number of studies may reduce power
- Poor-quality studies may influence pooled estimates
Download Dataset
Download Example Dataset (.xlsx)
Conclusion
Meta-Analysis – Continuous Measure in MedCalc is an essential statistical method for combining continuous outcome studies in biomedical and clinical research. Using means, standard deviations, and sample sizes, MedCalc calculates an overall pooled effect size and provides clear graphical interpretations through forest and funnel plots.
In this analysis:
- Eight studies were included
- Total sample size was 570
- The pooled SMD was -1.390
- The intervention effect was highly significant
- Heterogeneity was absent (I² = 0%)
- Publication bias tests indicated possible bias
The forest plot demonstrated a strong and consistent intervention effect across studies, while the funnel plot suggested potential publication bias. Overall, the analysis confirmed that the intervention produced a substantial and statistically significant improvement compared with the control group.
MedCalc remains one of the best software tools for performing continuous measure meta-analysis because of its simplicity, accuracy, and high-quality visualization features.


