
Introduction
Meta-analysis is one of the most powerful statistical techniques used in biomedical and clinical research. It combines findings from multiple studies to obtain an overall pooled estimate. When studies report correlation coefficients between two variables, researchers can perform a Meta-Analysis of Correlation.
What is Meta-Analysis Correlation?
Meta-analysis correlation combines correlation coefficients (r values) from several studies to estimate the overall relationship between two variables.
Example
Suppose several studies investigate the relationship between:
- BMI and Blood Pressure
- Cholesterol and Heart Disease
- Stress and Sleep Quality
Each study reports a correlation coefficient (r). Meta-analysis combines these r values into one pooled correlation estimate.
What is Correlation Coefficient (r)?
The correlation coefficient measures the strength and direction of the relationship between two variables.
| r Value | Interpretation |
|---|---|
| +1 | Perfect positive correlation |
| 0 | No correlation |
| -1 | Perfect negative correlation |
Example Interpretation
- r = 0.20 → Weak positive correlation
- r = 0.65 → Strong positive correlation
- r = -0.70 → Strong negative correlation
Example Biomedical Dataset
Meta-Analysis Table
| Study | Sample Size | Correlation_r |
|---|---|---|
| Study 1 | 50 | 0.62 |
| Study 2 | 45 | 0.55 |
| Study 3 | 60 | 0.71 |
| Study 4 | 40 | 0.49 |
| Study 5 | 55 | 0.66 |
| Study 6 | 70 | 0.73 |
| Study 7 | 48 | 0.58 |
| Study 8 | 65 | 0.69 |
📥 Download Dataset
Example Raw Correlation Dataset
Before meta-analysis, each study first calculates its own correlation coefficient.
Example raw biomedical dataset:
| Patient | BMI | Blood Pressure |
|---|---|---|
| 1 | 22 | 110 |
| 2 | 24 | 115 |
| 3 | 26 | 118 |
| 4 | 28 | 125 |
| 5 | 30 | 130 |
How to Calculate Correlation Coefficient
In Excel
Suppose:
- BMI → Column A
- BP → Column B
Use Excel formula:
The output gives the Pearson correlation coefficient (r).
📥 Download Raw Correlation Dataset
Step-by-Step Meta-Analysis Correlation in MedCalc
Step 1: Open Analysis
Go to:
👉 Statistics → Meta-analysis → Correlation
Step 2: Select Variables
Studies
Select:
- Study
Number of Cases
Select:
- Sample_Size
Correlation Coefficients
Select:
- Correlation_r
Options Explanation
Forest Plot
Forest plot displays:
- Individual study effects
- Confidence intervals
- Overall pooled effect
✔ Recommended for all analyses
Marker Size Relative to Study Weight
Fixed Effect Model
Assumes all studies estimate the same effect.
Random Effect Model
Accounts for variability between studies.
✔ Recommended for biomedical studies.
Diamonds for Pooled Effects
The diamond shape represents:
- Overall pooled correlation
- Confidence interval
Funnel Plot
Used to detect:
- Publication bias
- Small study effects
✔ Recommended
Recommended Settings
✔ Forest Plot
✔ Random Effect Model
✔ Plot pooled effect
✔ Diamonds for pooled effects
✔ Funnel Plot
Result Table Interpretation
Based on your MedCalc output
| Study | Correlation (r) | Interpretation |
|---|---|---|
| Study 1 | 0.620 | Strong positive correlation |
| Study 2 | 0.550 | Moderate positive correlation |
| Study 3 | 0.710 | Strong positive correlation |
| Study 4 | 0.490 | Moderate correlation |
| Study 5 | 0.660 | Strong positive correlation |
| Study 6 | 0.730 | Strong positive correlation |
| Study 7 | 0.580 | Moderate positive correlation |
| Study 8 | 0.690 | Strong positive correlation |
Overall Pooled Effect Interpretation
Fixed Effects Model
- Pooled r = 0.649
- 95% CI = 0.589 to 0.701
- P < 0.001
Random Effects Model
- Pooled r = 0.649
- 95% CI = 0.589 to 0.701
- P < 0.001
Interpretation
👉 There is a statistically significant strong positive correlation between BMI and Blood Pressure across all studies.
Forest Plot Interpretation
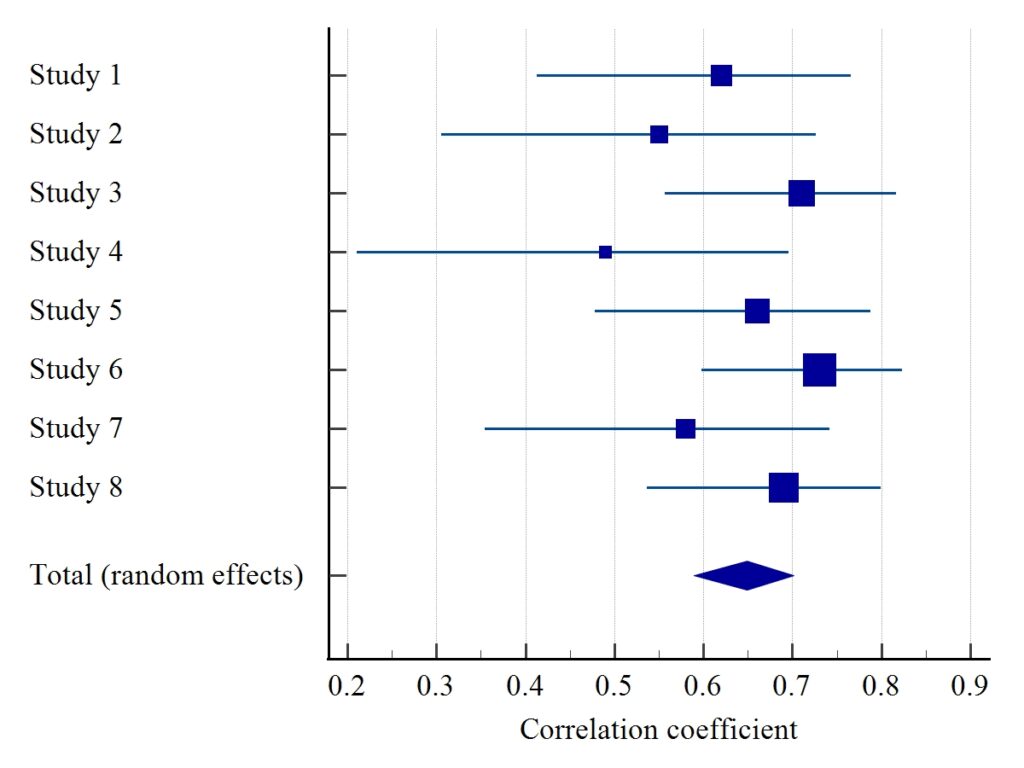
- Squares = individual study effects
- Horizontal lines = confidence intervals
- Diamond = pooled effect
The pooled diamond is centered around 0.65, indicating strong positive correlation.
Since most confidence intervals overlap:
✔ Results are consistent across studies.
Heterogeneity Interpretation
| Statistic | Value |
|---|---|
| Q | 6.4761 |
| P-value | 0.4854 |
| I² | 0.00% |
Interpretation
- P > 0.05 → No significant heterogeneity
- I² = 0% → Very low inconsistency
👉 Studies are highly consistent.
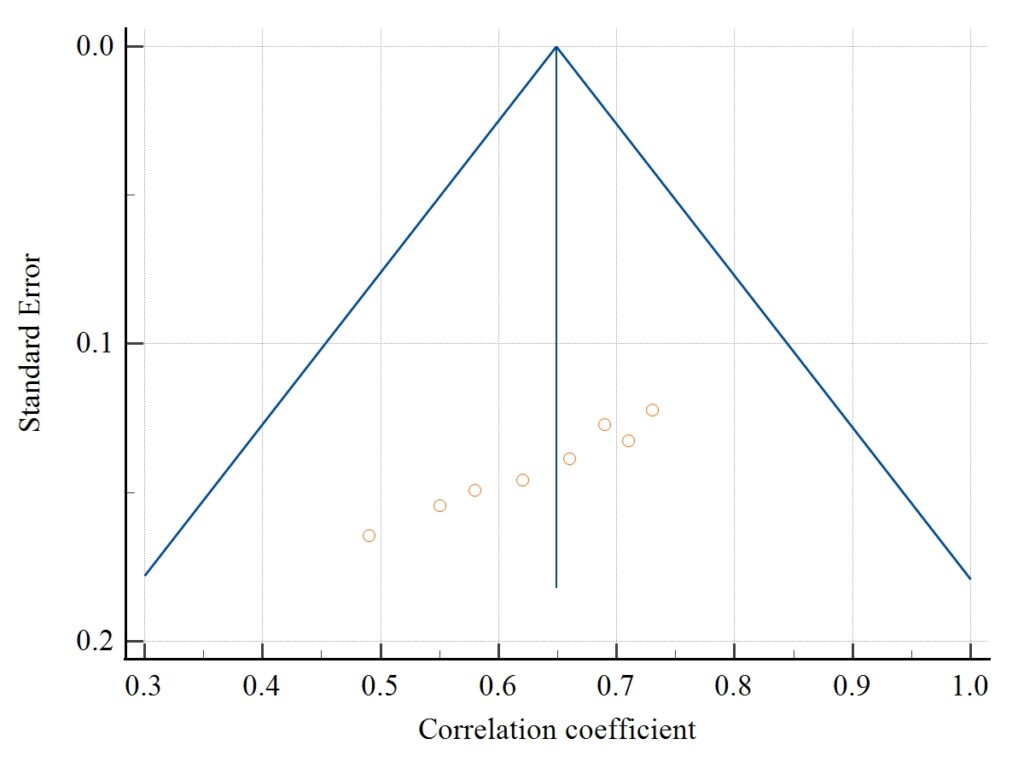
Funnel Plot Interpretation
The funnel plot helps evaluate publication bias.
Publication Bias Results
Egger’s Test
- P < 0.0001
Begg’s Test
- P = 0.0013
Interpretation
Both tests are statistically significant.
👉 Possible publication bias may exist.
This means:
- Smaller studies with weaker correlations may not have been published.
Why Meta-Analysis Correlation is Important
Meta-analysis correlation is widely used in:
- Biomedical research
- Clinical trials
- Psychology
- Epidemiology
- Public health
It improves:
✔ Statistical power
✔ Reliability of evidence
✔ Overall research conclusions
Advantages of Meta-Analysis Correlation
✔ Combines multiple studies
✔ Produces stronger evidence
✔ Detects overall relationships
✔ Improves decision making
Conclusion
Meta-Analysis Correlation in MedCalc is a powerful statistical technique used to combine correlation coefficients from multiple studies. In this tutorial, we learned:
✔ How to prepare correlation datasets
✔ How to calculate correlation coefficient (r)
✔ How to perform meta-analysis in MedCalc
✔ Forest plot interpretation
✔ Funnel plot interpretation
✔ Heterogeneity and publication bias analysis
The pooled correlation result showed a strong positive relationship between BMI and Blood Pressure, demonstrating the usefulness of correlation meta-analysis in biomedical research.


