
Introduction
In biomedical and clinical research, comparing three or more independent groups is common. When data are normally distributed, researchers typically use One-Way ANOVA. However, when the normality assumption is violated or sample sizes are small, a nonparametric alternative becomes necessary.
The Kruskal–Wallis test is a nonparametric method used to compare medians across multiple independent groups. It does not assume normal distribution and is based on ranking data rather than raw values.
In this article, we demonstrate a complete Kruskal–Wallis test in MedCalc using cholesterol level data (mg/dL) across three independent groups:
- Group A
- Group B
- Group C
We will cover:
- Descriptive statistics
- Test statistic interpretation
- Dunn post hoc analysis
- Box plot visualization
- Practical clinical interpretation
This tutorial is designed for researchers, medical students, PhD scholars, and biostatistics learners.
Study Design and Data Description
Dependent Variable:
Cholesterol (mg/dL)
Independent Factor:
Group (A, B, C)
Sample Size:
Total n = 15 result
Each group contains 5 observations.
📥 Download Cholesterol Dataset (Excel File)
Descriptive Statistics
From your MedCalc output result:
| Group | n | Min | 25th % | Median | 75th % | Max |
|---|---|---|---|---|---|---|
| A | 5 | 176 | 177.5 | 182 | 186.25 | 190 |
| B | 5 | 165 | 167.25 | 169 | 170.5 | 172 |
| C | 5 | 150 | 151.5 | 155 | 158.5 | 160 |
Observations
- Group A shows the highest median cholesterol (182 mg/dL).
- Group B has intermediate values (median = 169 mg/dL).
- Group C has the lowest median (155 mg/dL).
- The groups appear clearly separated.
The box plot visually confirms this decreasing trend:
A > B > C
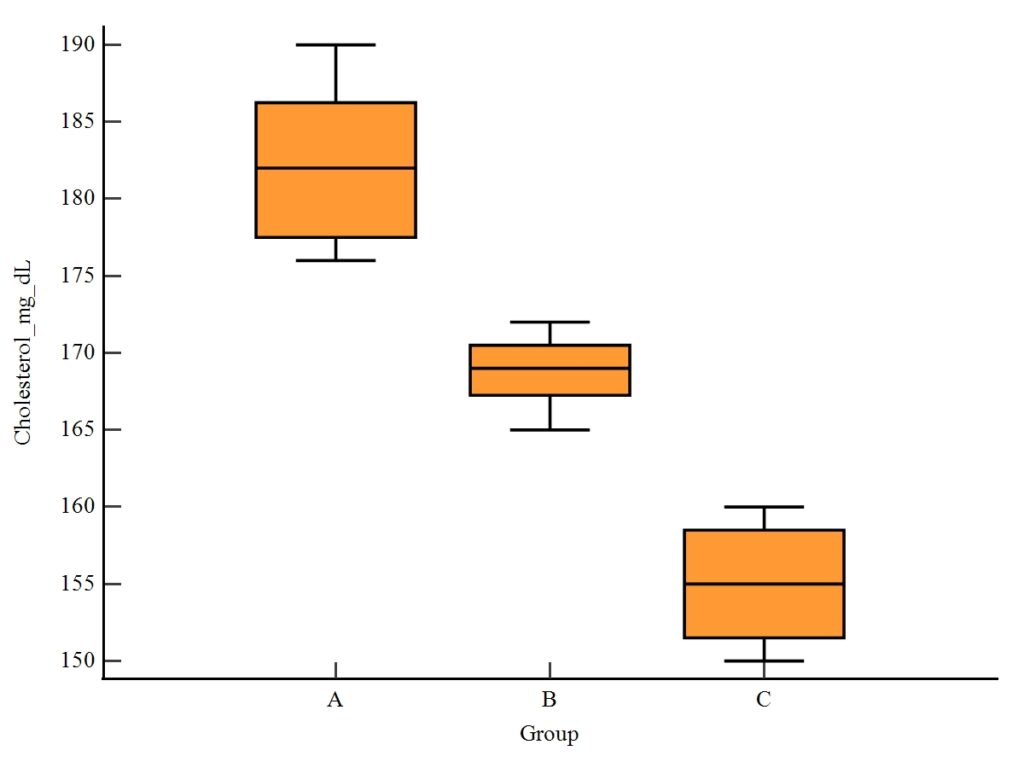
Box plot showing cholesterol distribution across Groups A, B, and C.
Why Use the Kruskal–Wallis Test?
Kruskal–Wallis is used when:
- Comparing ≥ 3 independent groups
- Data are not normally distributed
- Sample sizes are small
- Outliers may be present
It is the nonparametric alternative to One-Way ANOVA.
Instead of comparing means, it compares rank sums across groups.
Kruskal–Wallis Test Results
From MedCalc result:
| Statistic | Value |
|---|---|
| Test statistic (H) | 12.5000 |
| Degrees of freedom | 2 |
| P-value | 0.001930 |
Interpretation of Kruskal–Wallis Test
Since P = 0.00193 < 0.05, we reject the null hypothesis.
Statistical Conclusion:
There is a statistically significant difference in cholesterol levels among at least one of the three groups.
However, the Kruskal–Wallis test does not indicate which groups differ. Therefore, post hoc testing is required.
Post Hoc Analysis: Dunn Test
MedCalc performed Dunn’s multiple comparison test result.
Average Ranks
| Group | Average Rank |
|---|---|
| A | 13.00 |
| B | 8.00 |
| C | 3.00 |
Significant Differences (P < 0.05)
- Group A differs significantly from Group C
- Group C differs significantly from Group A
- Group B does not significantly differ from A or C at the 0.05 level
Post Hoc Interpretation
- Group A vs Group C
Significant difference (largest separation) - Group B vs Group A
Not statistically significant - Group B vs Group C
Not statistically significant
What Does This Mean?
The strongest evidence of difference exists between Group A and Group C.
Group B appears intermediate and does not significantly differ from either group.
Clinical Interpretation
From a biomedical perspective:
- Group A has highest cholesterol values
- Group C has lowest cholesterol values
- Group B shows moderate levels
If these groups represent:
- Different treatments
- Different diets
- Different drug doses
Then the data suggest a clear reduction in cholesterol from Group A to Group C.
Clinically, a reduction from 182 mg/dL to 155 mg/dL is meaningful and may significantly reduce cardiovascular risk.
Comparison with One-Way ANOVA
If the data were normally distributed, One-Way ANOVA could be used. However:
- Kruskal–Wallis is more robust
- Less sensitive to outliers
- Appropriate for small samples
In your case (n = 5 per group), the nonparametric approach is justified.
Advantages of Kruskal–Wallis Test
- No normality assumption
- Works with ordinal data
- Suitable for skewed distributions
- Simple interpretation
Limitations
- Tests medians, not means
- Less powerful than ANOVA if normality holds
- Does not directly measure effect size
How to Report in Research Paper
Example:
A Kruskal–Wallis test showed a statistically significant difference in cholesterol levels among groups (H(2) = 12.50, p = 0.0019). Dunn post hoc analysis indicated that Group A differed significantly from Group C.
Conclusion
This Kruskal–Wallis analysis in MedCalc demonstrated a statistically significant difference in cholesterol levels across three independent groups.
Key findings:
- Overall significant difference (P = 0.00193)
- Strongest difference between Group A and Group C
- Group B shows intermediate values
- Box plot visually confirms ranking pattern
The Kruskal–Wallis test is a powerful and reliable nonparametric alternative to ANOVA and is particularly useful in small biomedical datasets.
MedCalc provides a clear and structured output, making interpretation straightforward for researchers and students.


